By Matthew Holden and Justin Schor
One of the most apparent impacts of the response to COVID-19 is the dramatic change in people’s movement throughout the day, and the locations where they are choosing to go. Data on vehicle miles traveled, transit, and bikeshare during March 2020 reveal an interesting story.
![]() For example, according to data released by Streetlight Data, vehicle miles traveled (VMT) in Washington, DC have decreased 85% since January 2020. Similarly, the Washington Metropolitan Transportation Authority (WMATA) has reported declines of as much as 96% in Metrorail ridership and 82% in bus ridership. Another transportation option integral to the region, Capital Bikeshare, has also seen significant disruptions and changes in travel patterns.
For example, according to data released by Streetlight Data, vehicle miles traveled (VMT) in Washington, DC have decreased 85% since January 2020. Similarly, the Washington Metropolitan Transportation Authority (WMATA) has reported declines of as much as 96% in Metrorail ridership and 82% in bus ridership. Another transportation option integral to the region, Capital Bikeshare, has also seen significant disruptions and changes in travel patterns.
By comparing Capital Bikeshare ridership data from March 2019 to March 2020, we can start to understand how typical bikeshare usage around the region has changed since people began reacting to COVID-19.
Bikeshare Ridership: 2019 vs 2020
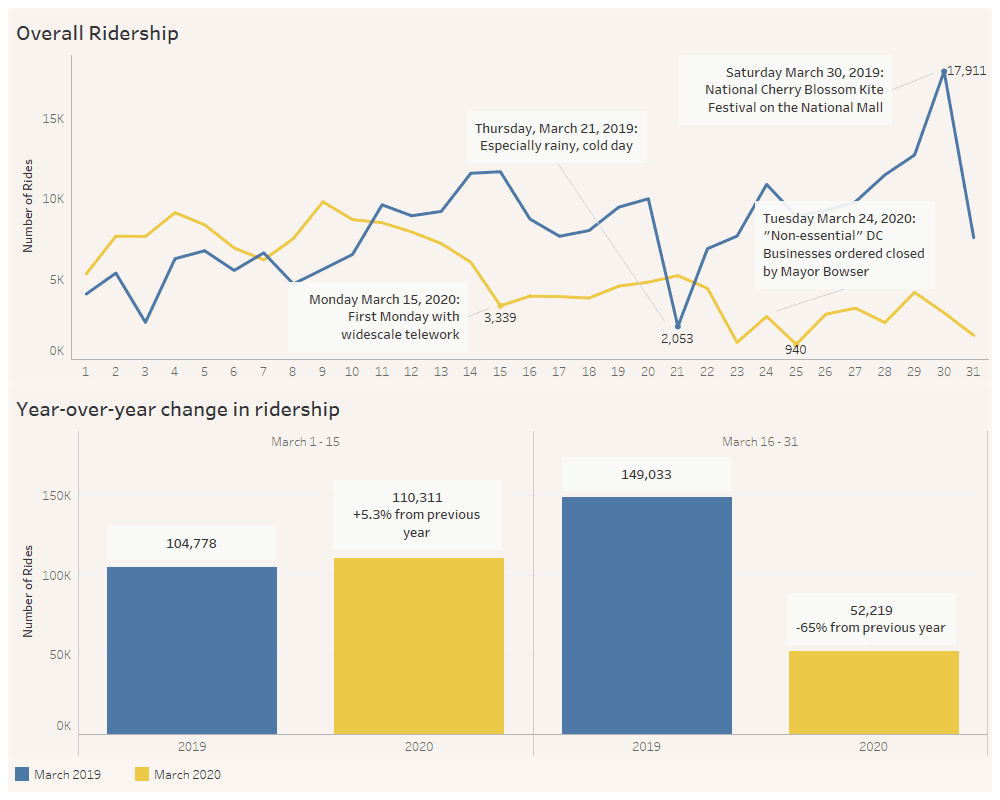
Overall, bikeshare ridership was down 35.9% in March 2020 compared to March 2019. Breaking this down further, the first half of the month saw a 5.2% increase in ridership. It’s possible that some transit riders shifted to bikeshare before stay-at-home orders were issued but concerns about the spread of COVID-19 were growing. The second half of March 2020, however, saw a decline of 65%. The closure of offices and non-essential businesses likely contributed to this decline the most. While significant, the ridership decline was less than VMT or transit ridership.
Capital Bikeshare Station Usage Patterns
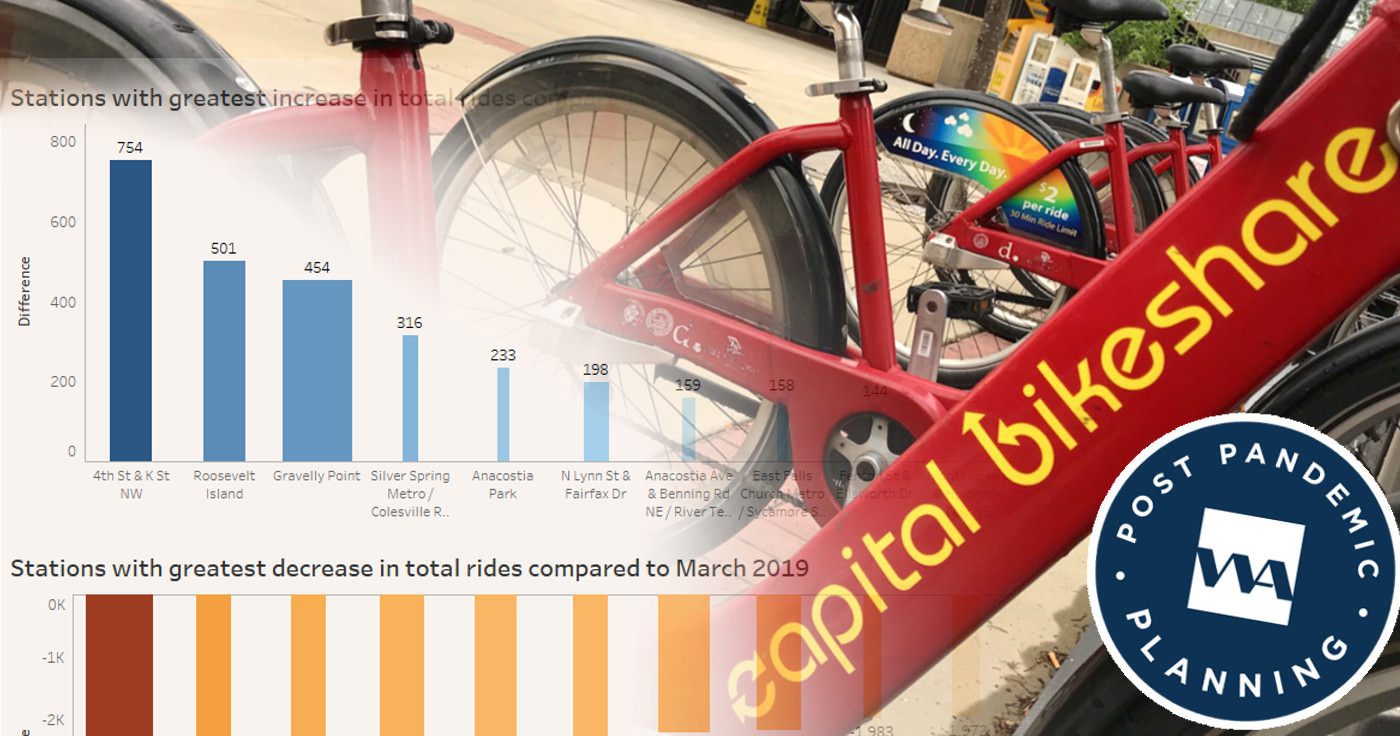
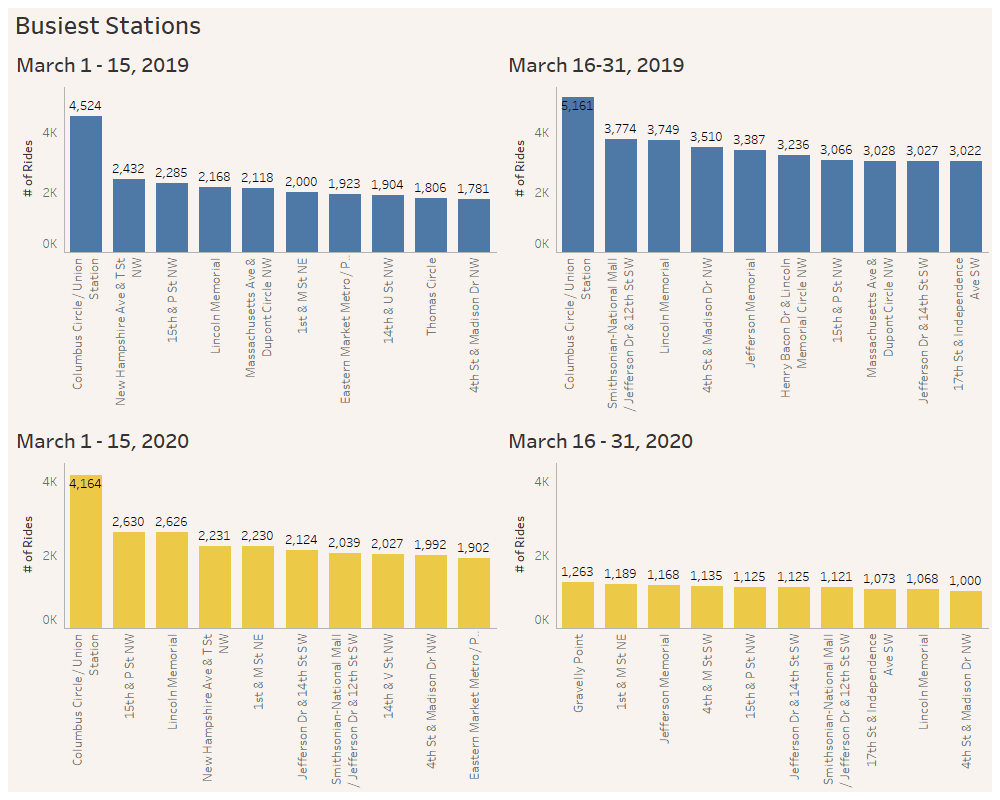
While ridership declined overall, changes in ridership were not even across the whole system and not every station saw reduced ridership. Of the 531 stations in the system, 96 or 18% saw an increase in ridership compared to 2019.
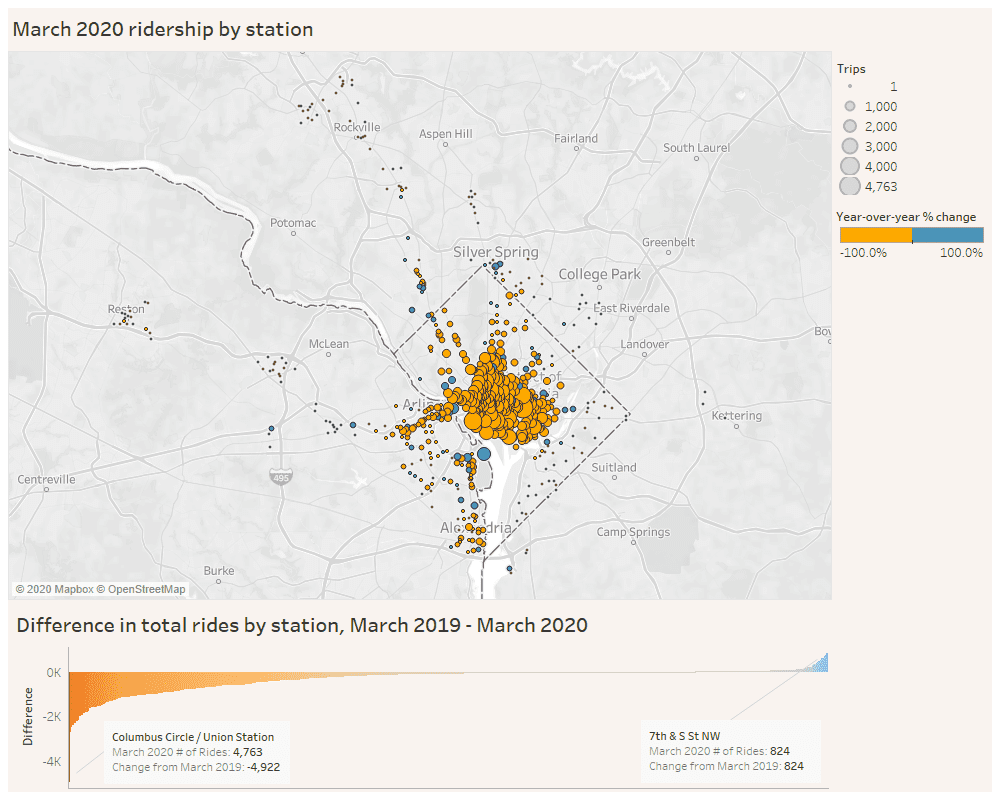
In Washington, DC, the 4th and K St NW bikeshare station saw the largest increase compared to 2019 (7th & S St NW is a new station and technically saw more rides), likely due to new apartment and office building opening in the immediate vicinity, but many of the other stations that saw increased ridership were stations at places like Roosevelt Island, Gravelly Point, and Anacostia Park. All these stations are located at key regional parks, perhaps indicating a shift in rides away from commuting and towards a focus on bikeshare as a recreational opportunity. Further supporting this idea is the number one decliner in raw trips: Columbus Circle / Union Station. Typically the busiest station in the system, the station did not crack the top ten in the second half of the month.
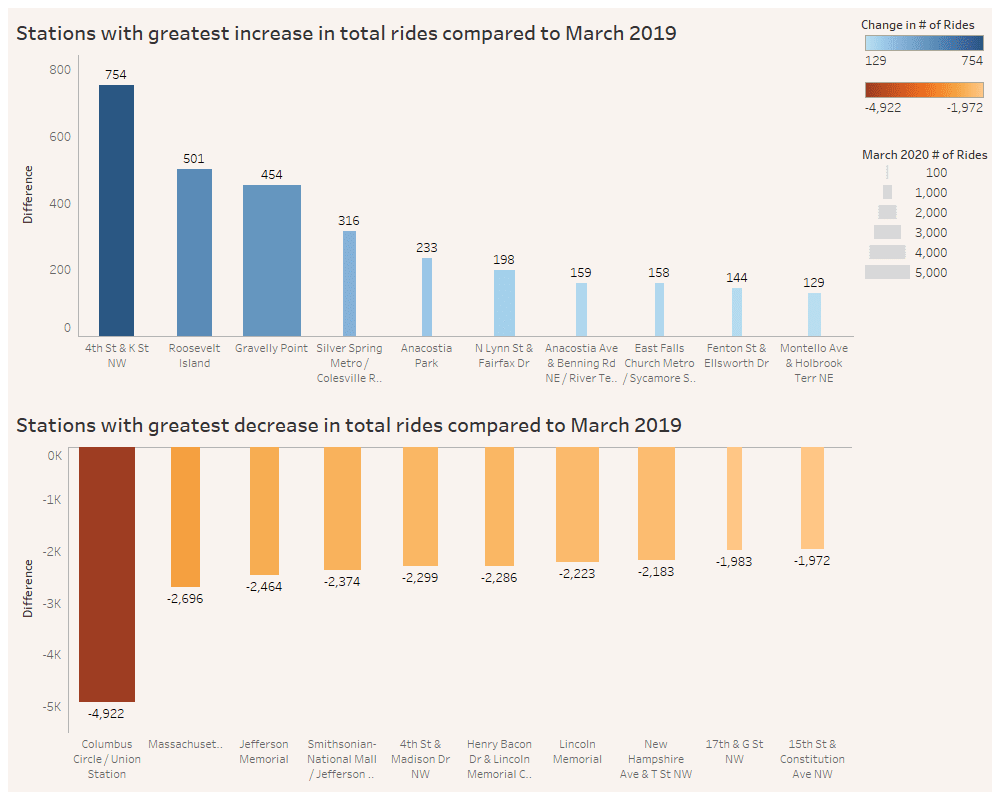
Under typical circumstances, the top ten busiest stations in the system are consistent. Looking at the charts for both periods in March 2019 and the first half of March 2020, the same stations pop up again and again. Destinations with a heavy number of office buildings or commuting hubs like Columbus Circle / Union Station, Thomas Circle or Massachusetts Ave & Dupont Circle stand out, as well as residential areas like New Hampshire and T St NW.
“While other activities for recreation have closed, Capital Bikeshare appears to be providing an outlet for many people. … The collapse of the office commuting schedule and move towards recreational and other types of the trips dominating the system is clear in this pattern.”
Locations near the Mall also stand out, such as the Lincoln Memorial. While many of these stations remain busy in the second half of March 2020, Gravelly Point becomes the busiest station in the whole system, indicating a surge in purely recreational rides.
Origin-Destination Patterns: 2019 vs 2020
Comparing the origin and destination stations of individual trips also reveals evolving patterns across the system. In the first half of March for both 2019 and 2020, the most common trips between stations were a mix of stations on or around the National Mall and “commuting” stations. Trips from the Lincoln Memorial to Jefferson Memorial were very common, as well as trips between Union Station on H Street NE, a distance close enough to walk but much faster when biking. In the second half of March for both years things change significantly.
First, the second half of March 2019 saw extremely high ridership due to the National Cherry Blossom festival, especially during the National Cherry Blossom Kite Festival on March 30th. This caused the top origin-destination stations to shift heavily towards locations on or around the Mall. Many of the top trips began and ended at the same station, indicating purely recreational trips. While there were many recreational trips, common commuter trips remained in the top ten.
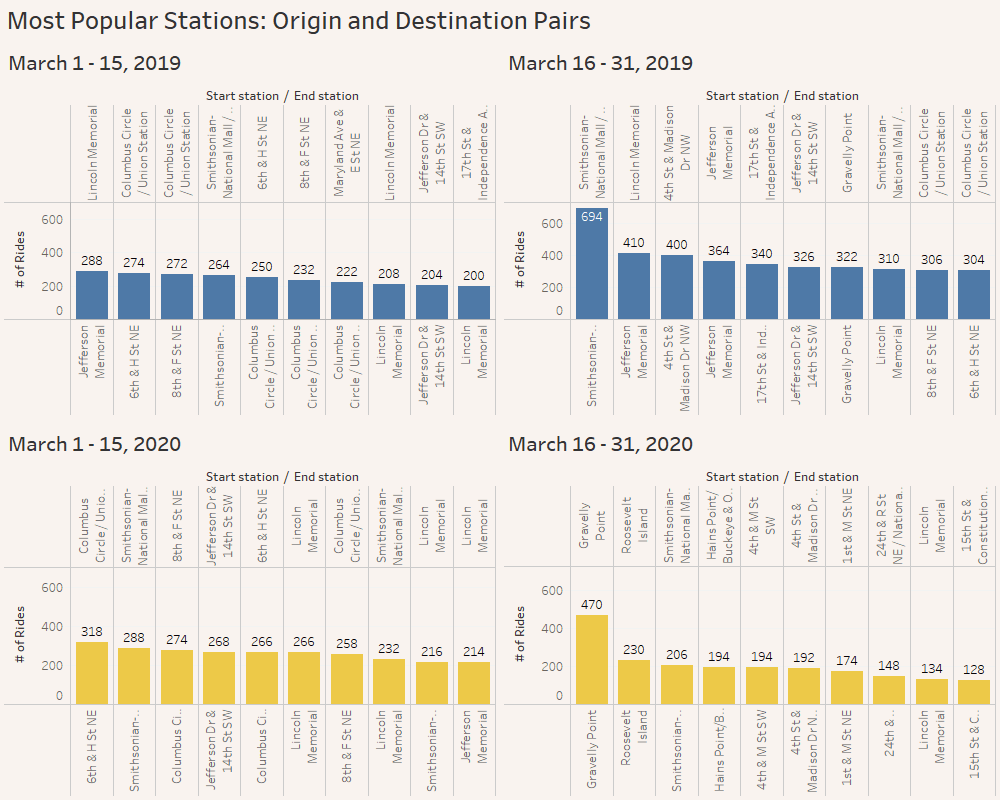
This pattern also emerges much more aggressively in the second half of March 2020, with each of the top ten most common trips beginning and ending at the same station. While some spots around the Mall appear, it is notable that the top two most common trips begin and end at either Gravelly Point or Roosevelt Island – both of which were previously relatively uncommon trips. While other activities for recreation have closed, Capital Bikeshare appears to be providing an outlet for many people.
“While ridership of the Capital Bikeshare system was down overall in March 2020, system usage decreased less than other modes of transportation in the region over a comparable time frame.”
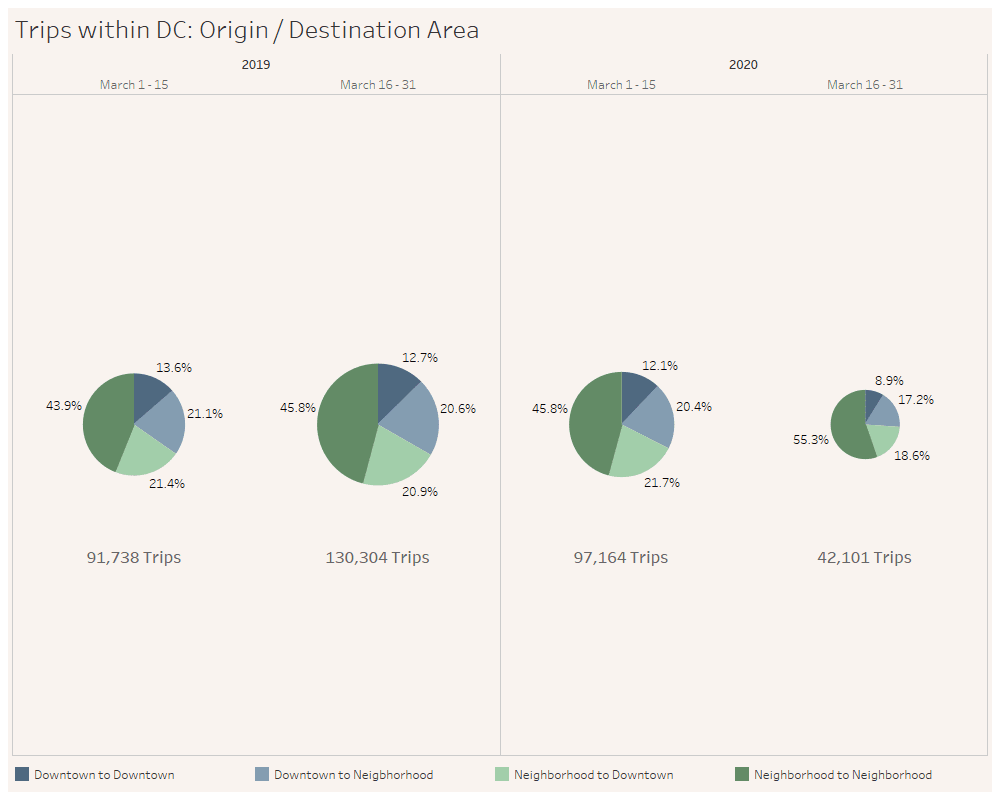
Focusing on trips that began and ended inside of DC, particularly rides to and from Downtown, an interesting origin-destination pattern emerges. Typically, more than half of all trips are either to, from, or within Downtown (as defined as a trip to a station within the Central Employment Area). In the second half of March 2020 trips involving Downtown only make up 44.7% of all trips. This decline is further evidence of the collapse of 9-to-5 commuter usage of the system.
Time of Day Patterns Completely Disappear During COVID-19
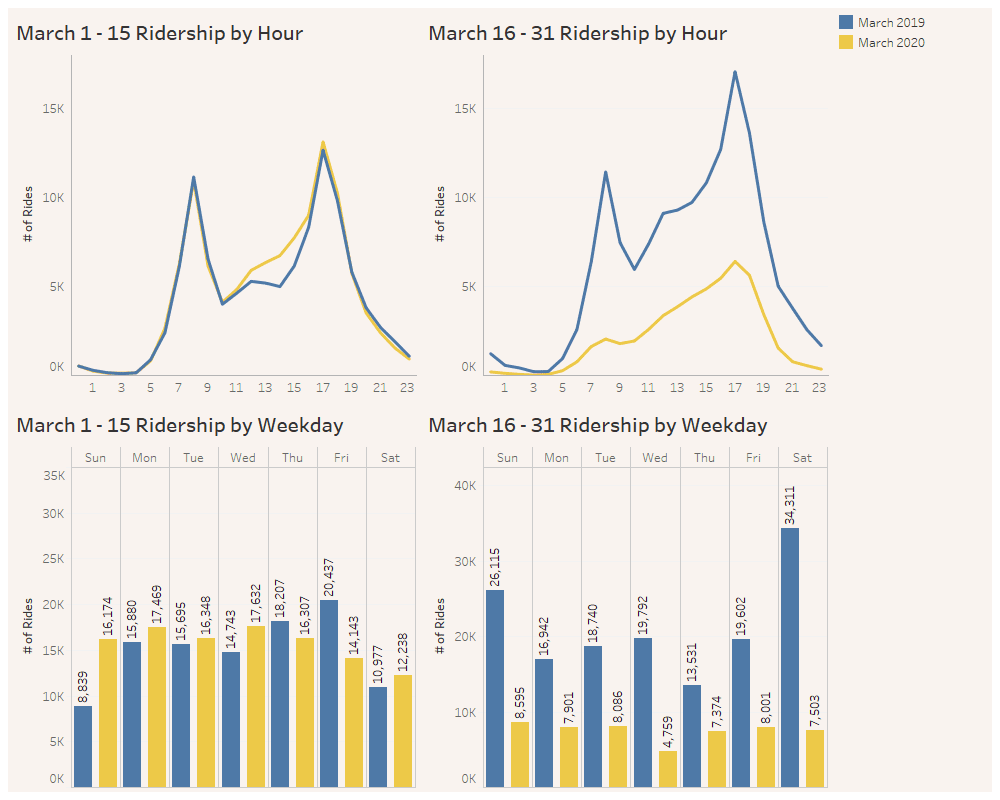
Hourly ridership and patterns across the days of the week also vary. The typical pattern for bikeshare ridership is defined by sharp peaks – one at 8:00 am and another at 5:00 pm with lower ridership before and after and a moderate lull in between. This is true of all of March 2019 and the first half of March 2020 and is indicative of the large number of people who use Bikeshare for their commute to and from jobs on a roughly 9:00 am to 5:00 pm schedule.
During the second half of March 2020, however, this pattern completely disappears. Instead, ridership slowly grows over the course of the day with only a slight bump at 8:00 am, but a clear peak at 5:00 pm and a more gradual slope through the evening. The collapse of the office commuting schedule and move towards recreational and other types of the trips dominating the system is clear in this pattern.
Summary
While ridership of the Capital Bikeshare system was down overall in March 2020, system usage decreased less than other modes of transportation in the region over a comparable time frame. The origin and destination stations of reoccurring trips indicate that many people are using Capital Bikeshare for recreational trips, perhaps trying to get fresh air and exercise while other options are no longer available.
There was also an increase in usage at the beginning of the month compared to 2019, during a period before shutdowns but while many people may have thought twice about taking public transit or other modes where they might have to come into contact with another person. Aside from an increase in recreational usage, bikeshare may be picking up some typical transit riders who have shifted away due to service cuts or out of a desire to socially distance more effectively.
“We plan to publish follow-up analyses to help transportation providers, municipal authorities, businesses, and other institutions make the best mobility and transportation decisions possible.”
Municipalities where Capital Bikeshare has coverage should closely look at this dataset, as it reveals where people are still moving in an era of greatly reduced mobility. These trips are displaying patterns not typically seen and can provide better insight on what locations people consider essential, and what facilities need greater support.
As the weather gets warmer, stay-at-home orders continue, and people adjust to new schedules, it will be important to monitor and note continuing changes to ridership patterns. More granular analysis on the types of trips may produce interesting results. If possible, differentiating recreational trips from essential or other trips may be possible with additional effort. And when stay-at-home orders are lifted and people are concerned with physical or social distancing, it will be important to monitor how bikeshare fares compared to transit as a transportation choice.
As the situation with COVID-19 continues to change – whether due to revised stay-at-home orders, changing weather, or other circumstances – our DC-area transportation consulting team plans to publish follow-up analyses to help transportation providers, municipal authorities, businesses, and other institutions make the best mobility and transportation decisions possible.