By Camille Galdes, Justin Schor, and Heidi Thorne
For over a decade, Wells + Associates (W+A) has been managing traffic and commuting behavior in Fairfax County, VA, using Transportation Demand Management (TDM), which shifts travel behavior away from single-occupancy vehicles. To better understand the impact of TDM on traffic congestion in the region, W+A reviewed long-term data from its portfolio of Fairfax County TDM residential and office properties and found that all properties far surpassed their trip reduction goals. TDM was highly effective at preventing negative traffic impacts, making Fairfax County a model for sustainable real estate development.
Table of Contents (click to jump ahead)
- Developing TOD in a Suburban County
- Modeling Trip Rates and Establishing Reduction Goals
- Hindsight From 2020: Properties Supported by TDM Produced Much Fewer Trips than Expected
- Even Using ITE 11th Edition Rates, Baseline Trip Reduction Was Higher Than Expected
- Unexpected Synergies and Changes to the Marketplace
- Lessons from Fairfax County, Virginia
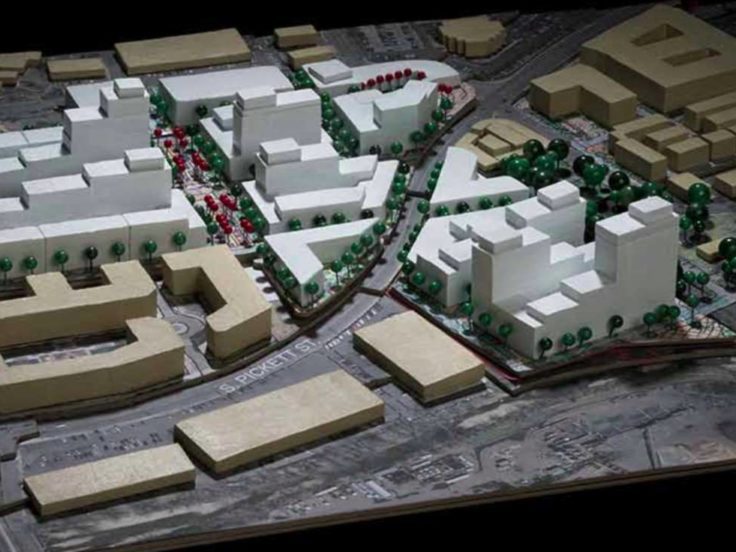
Developing TOD in a Suburban County
For over a decade, Wells + Associates (W+A) has been managing traffic in Fairfax County, VA, using Transportation Demand Management, which shifts travel behavior from single-occupancy vehicles to higher-occupancy modes and non-vehicular modes. Back in the mid-2000s, Fairfax County increasingly pursued Transit-Oriented Development (TOD) around Washington Metropolitan Area Transit Authority’s (Metro’s) Orange Line Stations as a means of focusing higher density growth in locations where more people would have more transportation choices.
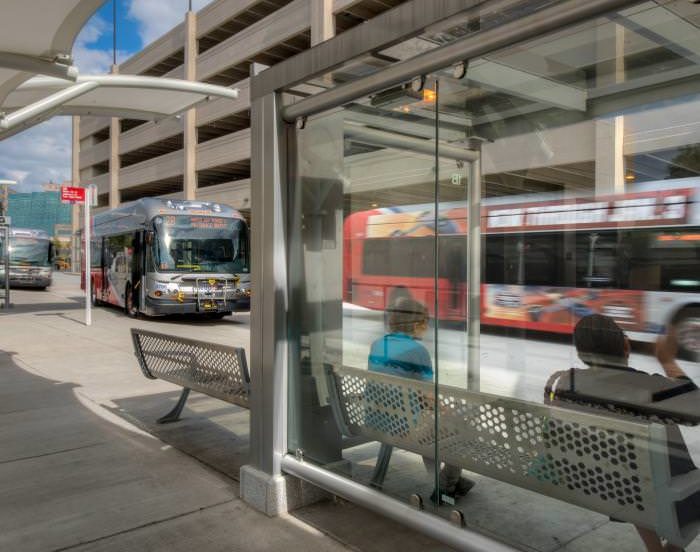
When suburban residents expressed concern that density would worsen traffic in their neighborhoods, the county established Transportation Demand Management (TDM) requirements, or “proffers,” for all new development with significant traffic impacts. These programs required that every new building reduce its impact on the road network by encouraging occupants to use more non-SOV (single-occupancy vehicle) modes that reduce peak hour congestion and prevent the transportation network from becoming overwhelmed.
Starting in 2007, Fairfax County included TDM measures and trip reduction requirements in its negotiations with developers regarding proffers. However, over time the county found this way of negotiating TDM resulted in inconsistent trip reduction goals. Similar projects in similar locales were subject to negotiated proffers which reflected the parties’ preferred trip reduction goals, rather than dictated by land use and site characteristics. Fairfax County decided to set county-wide standards based on land use and distance from transit connections and on January 1st, 2013, the county-wide TDM standards in Tables 1 and 2 went into effect.
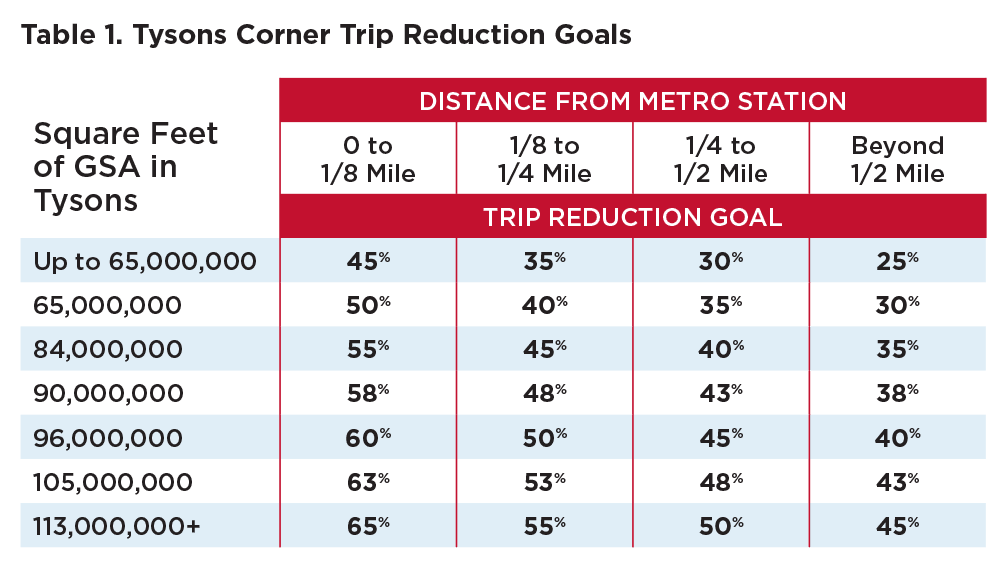
Fairfax County’s TDM requirements focused on reducing peak hour traffic congestion throughout the county by setting maximum rates of peak hour auto trips that new developments would be allowed to generate. Those peak hour thresholds were scaled so that properties closer to Metro stations would be required to generate fewer trips than comparable properties farther from Metro stations. As the urban center of Fairfax County, Tysons would have the highest density and proximity to several Metro stations, giving it an increased potential for peak hour trip reduction. Therefore, the County set higher trip reduction standards for the Tysons area (Table 1). The goal was that over time, as Tysons urbanized and added new development, it would also need to achieve increased trip reduction.
Modeling Trip Rates and Establishing Reduction Goals
But for new developments, how can trip rates be reduced when there are no existing trips? The Institute of Transportation Engineers (ITE) publishes the industry standard for estimating auto trips in and out of developments for all property types and uses. ITE’s estimated rates are based on case studies of existing properties from across the United States and Canada.
All of Fairfax County’s trip reduction goals were developed using the most current ITE trip generation estimates. County planners then adjusted these ITE estimates based on their knowledge of local conditions. For instance, planners knew that the county was investing in pedestrian infrastructure, more transit-oriented development (TOD) was underway, and additional transit stations would open along the Silver Line in the near future. Thus, rather than driving in a single-occupant vehicle (SOV), would-be drivers would have the option to travel using higher-occupancy modes, such as buses, trains, carpools or, better yet, vehicle-free modes like biking or walking.
Justin Schor, principal of the TDM practice group at Wells + Associates explains, “ITE trip generation rates are averages, by definition, and many communities decide to adjust trip generation expectations for their area using their local knowledge.”
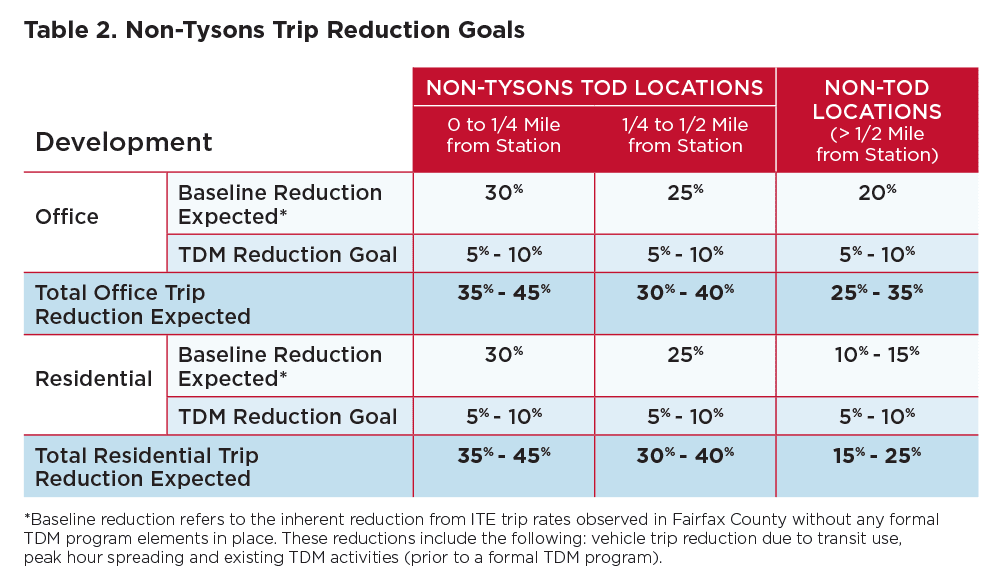
Fairfax County officials then set goals for how many trips must be reduced through Transportation Demand Management (TDM). For Tysons locations, the urban center for Fairfax County, buildings would need to utilize TDM strategies to reduce peak hour trips between 25% and 65% (see Table 1), depending on their proximity to Metrorail stations. In non-Tysons locations, expected trip reductions would go beyond a “baseline” amount of trip reductions that was expected to come naturally as the county urbanized. For example, Table 2 shows that in non-Tysons Fairfax County locations a property between a quarter and half mile from Metro would need to reduce trips from ITE estimates by a total of 30-40%. The county would consider 25% of the trip reduction as part of an adjusted “baseline” while another 5-10% would come from TDM programming.
Related Case Studies on Vehicle Trip Reductions
Hindsight From 2020: Properties Supported by TDM Produced Much Fewer Trips than Expected
Fairfax County proffers required that new properties, on an annual basis, monitor trips, survey tenants about their commuting habits, and demonstrate to the county that they continue to meet their trip reduction goals. Since 2012, Wells + Associates has been helping Fairfax County properties do just that—implement TDM programs and monitor their trip generation every year. A look at performance metrics over the seven-year study period (2013-2019) among 13 of Wells’ longest-standing programs reveals they have significantly surpassed their goals.
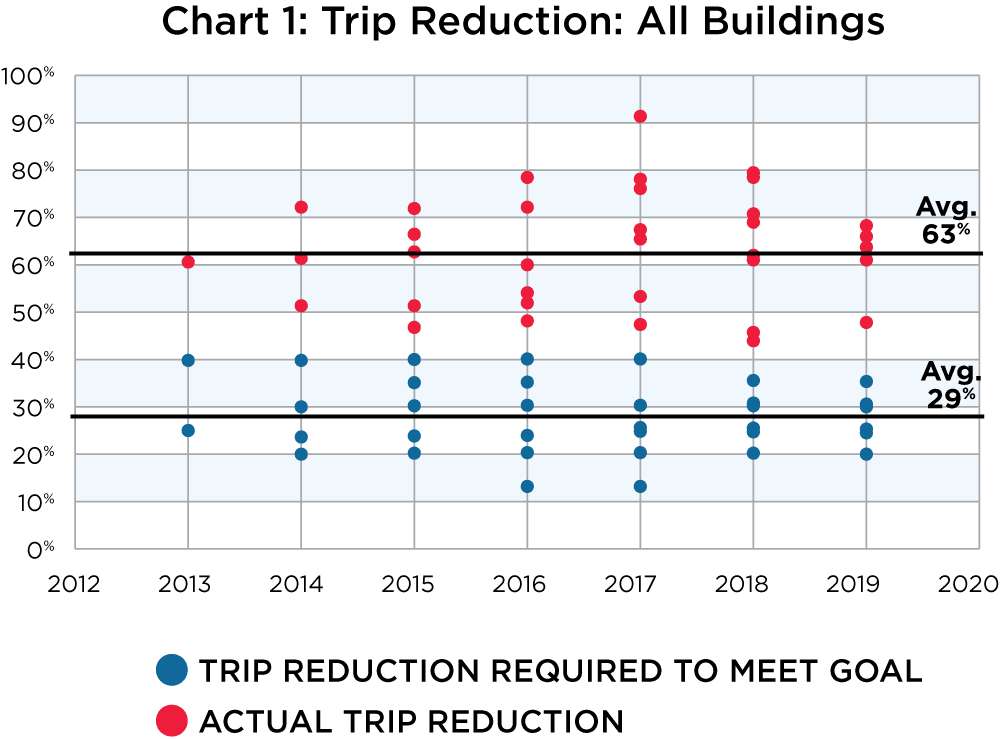
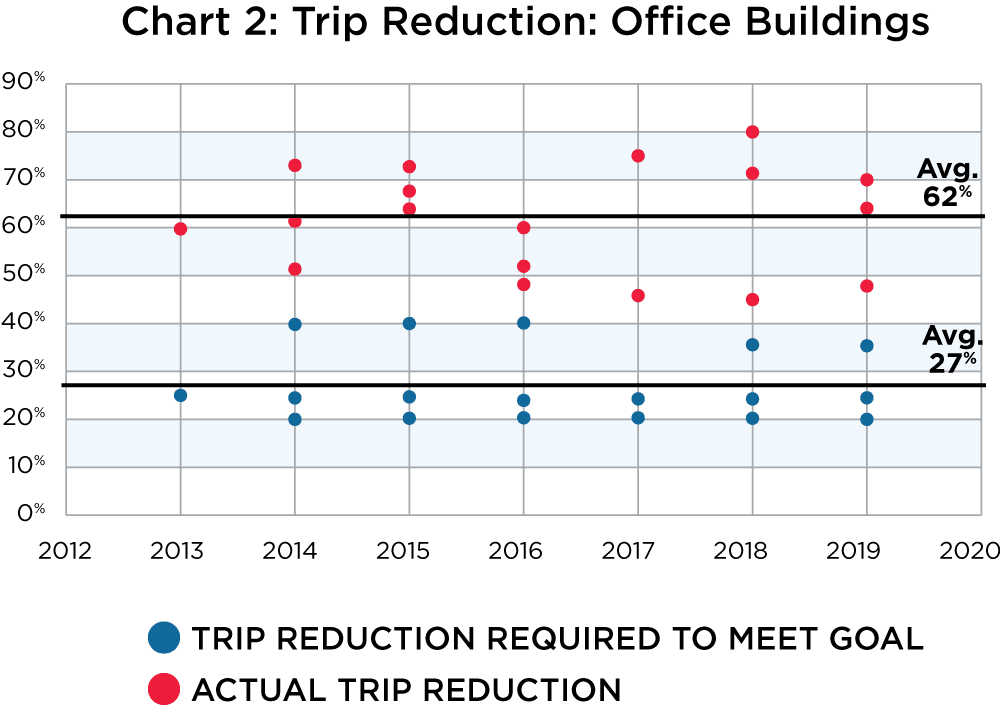
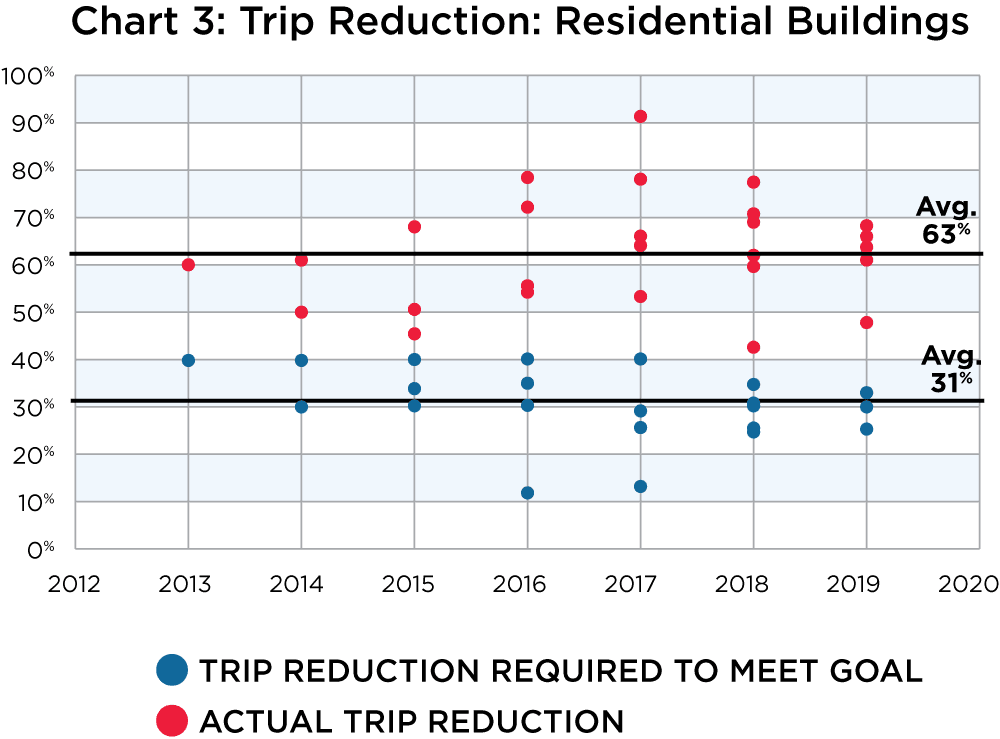
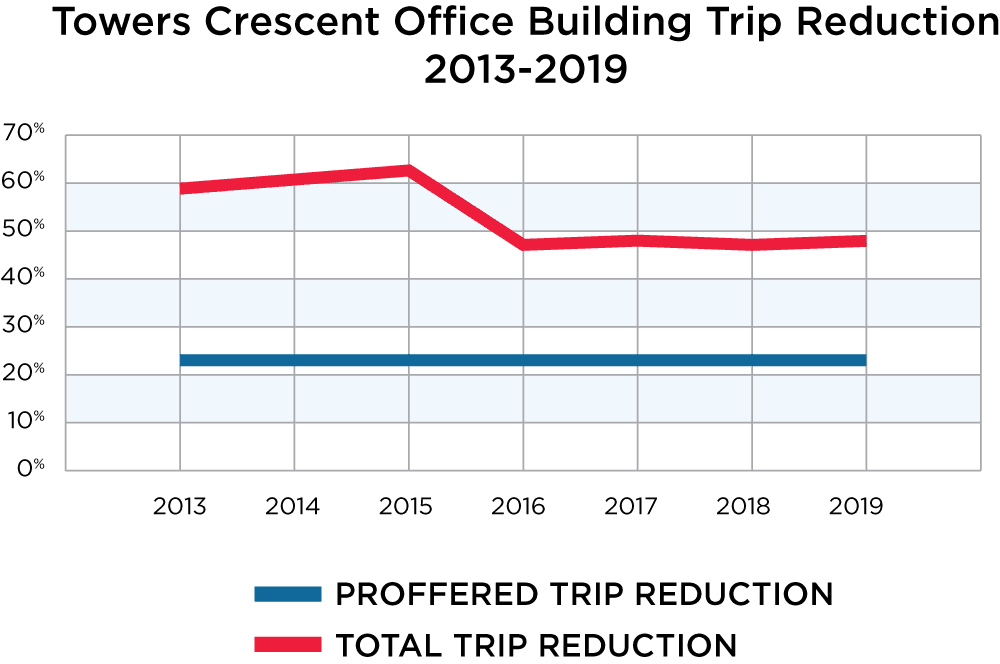
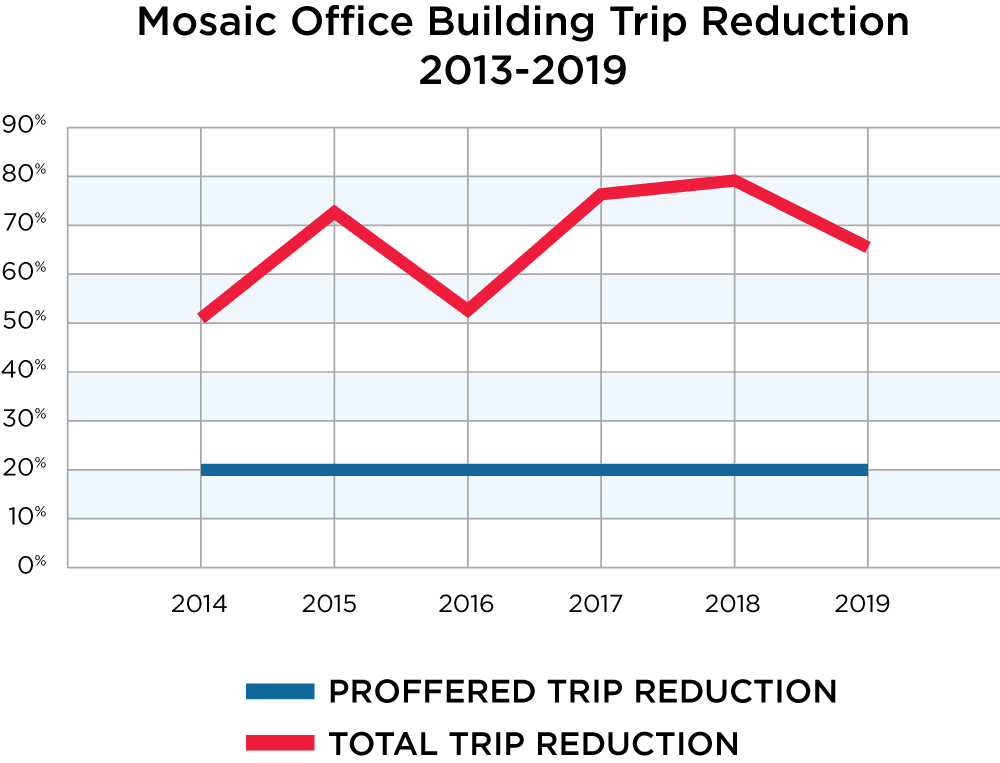
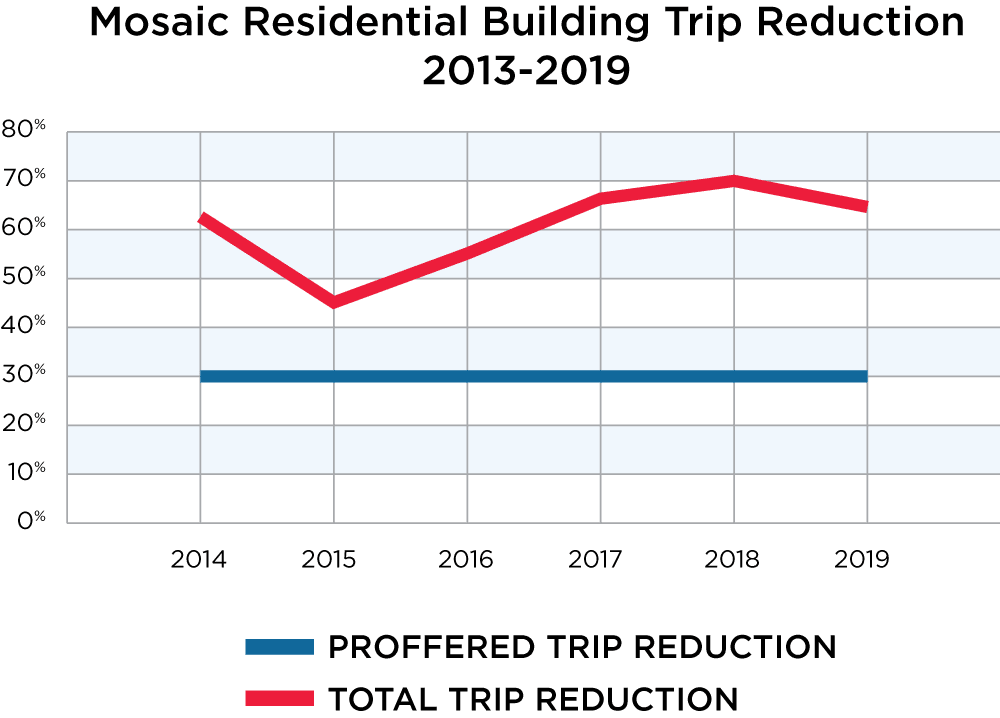
Among these 13 long-term TDM programs in Fairfax County, average trip reduction goals stood at 29% over the past 8 years (Chart 1): an average of 31% at residential properties and 27% at office properties (Chart 3). However, with support from W+A’s TDM programs trips to and from these properties were reduced by an average of 63% (Chart 1): 62% at office properties (Chart 2) and 63% at residential properties (Chart 3).
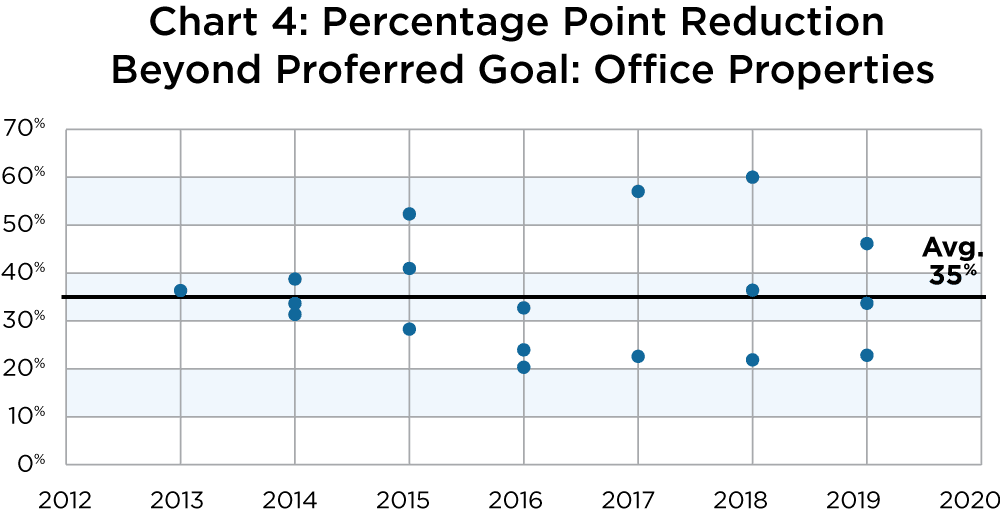
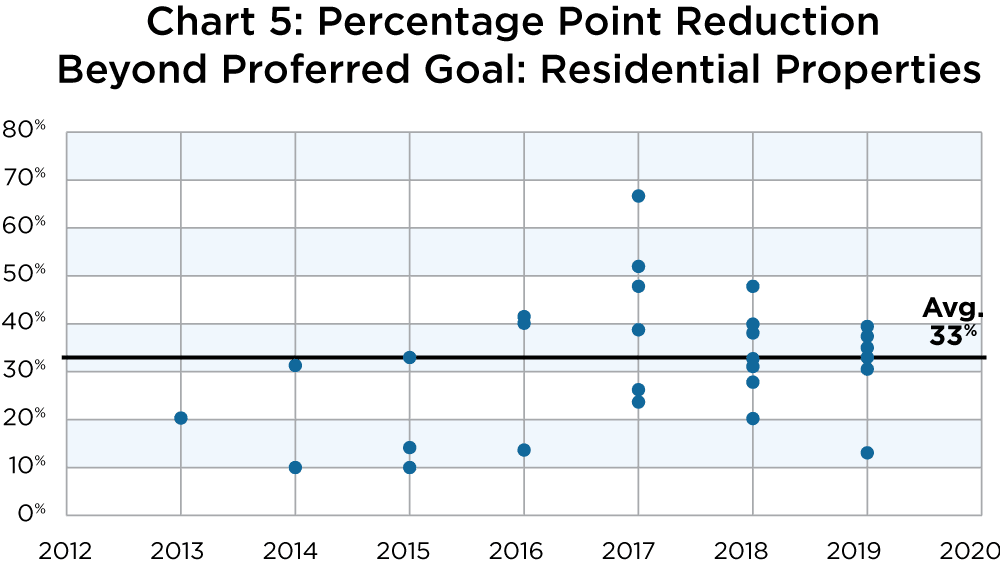
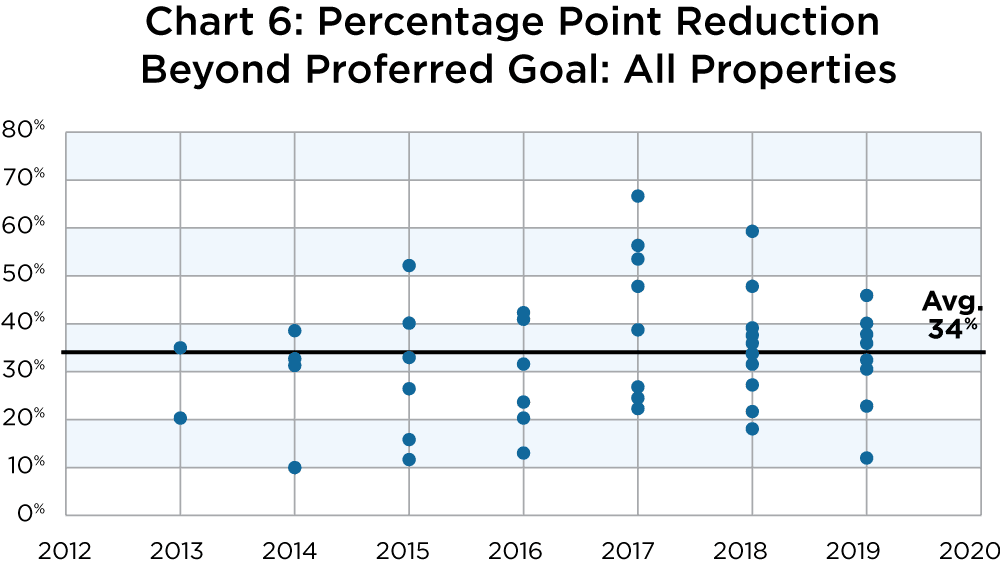
These reductions represent approximately twice as much traffic mitigation as the proffered requirements. Offices with TDM programs outperformed their goals by 35 percentage points (Chart 4) while residential properties outperformed them by 33 percentage points (Chart 5), for an average of 34 percentage points beyond proffered trip reduction goals (Chart 6).
Another way to look at the data is to see the percent change across only one property, showing the full life cycle of the property from when it first received TDM proffers to the present day. There are three properties in W+A’s portfolio that span several years and therefore provide long-term data. The performance over time of office tower Towers Crescent, as well as office and residential space in the mixed-use Mosaic District, demonstrates that their TDM programs have had sustained impact over the long-term.
Even Using ITE 11th Edition Rates, Baseline Trip Reduction Was Higher Than Expected
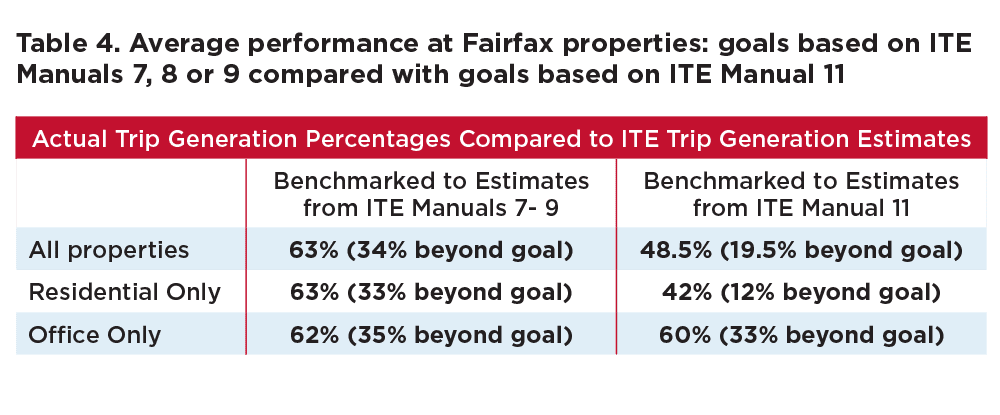
W+A adjusted its data set to reflect the most current ITE trip generation data, which represents the most conservative end of trip generation estimates since ITE’s 11th Edition Manual estimates result in lower trip generation totals than prior versions. ITE versions 7, 8 and 9 were largely consistent in their trip rate estimates for General Office and Mid-Rise Apartments, but version 11 showed reduced trip rates for General Office properties as well as Low- and High-Rise Apartments (See Table 3 below). ITE’s 11th Edition Manual reports higher trip estimates than its 10th Edition for some key land uses, such as General Office, but both editions report lower trip estimates than editions 7, 8 and 9 for these land use categories.
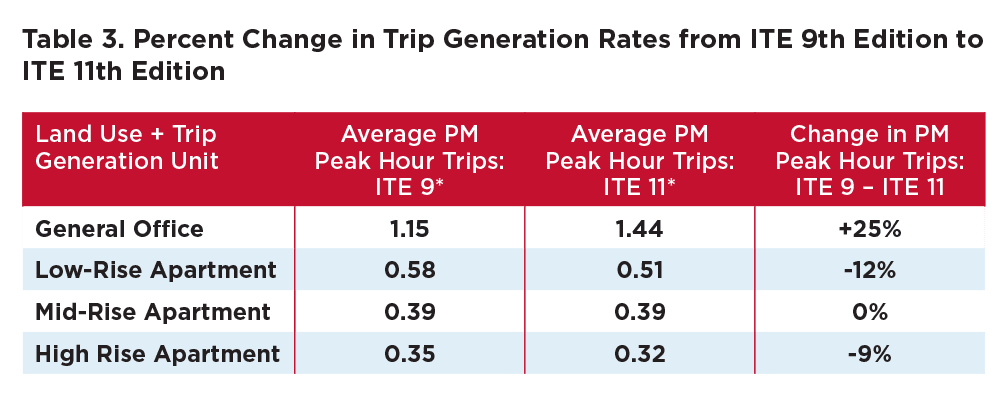
To provide a sense of how these properties would be performing against current benchmarks, W+A adjusted the dataset to the latest version of ITE’s trip generation manual, ITE 11th Edition. When the properties are evaluated using ITE’s 11th Edition, all properties with TDM programs showed a reduction of peak hour trips by an average of 48.5% rather than 63%; 60% at office properties and 42% at residential properties. Therefore, updating the trip generation rates by nearly a decade, these Fairfax properties still produced trip reduction percentages that go well beyond their proffered requirements. On average, properties reduced trips by 19.4 percentage points beyond their proffered goals, compared with 34 percentage points when measured by prior manuals. Since the 11th Edition reduced trip generation forecasts for three out of four land use categories (see Table 3 below), the actual trip counts have been measured against the most conservative trip generation estimates currently available.
Since ITE’s lowest possible trip generation rates still result in significantly more trip reduction than expected, it is clear that TDM programming has been highly effective in reducing trips over the long-term. However, additional forces have supported the impact of TDM in the region, such as land use policies and economic trends.
Unexpected Synergies and Changes to the Marketplace
Transportation Demand Management (TDM) is a flexible tool that reduces reliance on single-occupancy vehicle (SOV) travel. When a development is projected to have a significant impact on the road network, TDM relieves this pressure and brings traffic back down to manageable levels. However, in the case of Fairfax County, the degree to which trip reduction surpassed all expectations begs the question: was it all due to TDM or were other factors at play? While it is hard to disentangle the precise impact of each variable, it is clear that TDM and other policy decisions supported and magnified one another, reducing trips well beyond Fairfax County’s original expectations.
The amount of trip reduction expected for new developments in Fairfax County averaged 29%; Fairfax County projected that at non-Tysons locations around 5-10% of trip reduction would come from TDM programming and around 20% would occur naturally as the area urbanized. Although Fairfax County staff did not project what portion of the 25-65% of trip reduction in Tysons locations would come from TDM programming, it is highly likely to have met or exceeded the 10% trip reductions that TDM was projected to deliver in other portions of Fairfax County. Over seven years, the county achieved an average of 63% trip reduction across all properties, which is 33 percentage points beyond what was proffered on average. TDM policies appear to have had a larger impact than Fairfax County expected, although there is not a reliable way to quantify its impact. The alignment of land use and housing policies with TDM goals likely contributed to larger-than-expected trip reduction outcomes.
Market forces over the last decade have also put downward pressure on trip generation rates. ITE’s 10th and 11th Editions reflect changing patterns in the use of commercial real estate and in the transportation patterns they produce that have been a decade in the making. Before the pandemic, in 2019, retail closures hit a record high with nearly 10 thousand retail stores closing.[1] The same record number of closures from 2019 was hit in just one quarter of 2020.[2] According to Cushman Wakefield, “Digital sales in November through December rose 45.2%–more than triple the YoY rate for the prior season—with more than $1 in $4 spent online. E-commerce sales at year-end 2020 accounted for 19% of total retail sales in the U.S., compared to 15% at the end of 2019 before the pandemic hit the United States.” Twenty-six million square feet were returned to the market in 2020, the largest annual decline ever recorded.[3] While these economic shifts surely increased delivery trips, the dramatic reduction in retail trips likely netted much fewer total trips. Peak hour trips have most certainly dropped due to a large reduction in retail trips, which are usually made during peak hours, and their moderate replacement by deliveries, which are usually off-peak trips.
The 2020 pandemic also very much disrupted working patterns across the country, and indeed around the world, as the vast majority of workers switched to working from home. Anecdotal evidence, as well as W+A’s own database of traffic counts, indicates that office property trips plunged during the pandemic and remain extremely low compared to pre-pandemic levels, while residential buildings experienced a less dramatic decline and have since regained a majority of their trips in 2021. Given that the pandemic has lasted nearly 2 years already, it would not be a surprise if trip patterns associated with ecommerce growth as well as the increase in working from home will alter trip patterns for years to come. While the 11th ITE Manual did not use any data from the 2020 pandemic to calculate its trip generation estimates, it would not be a surprise if the next ITE manual, which can be expected in about 5 years in 2026, estimated steeper reductions in trip generation for a variety of commercial real estate types.
[1] Cushman Wakefield, Marketbeat Report, U.S. National Shopping Center Q4 2019. www.crescorealestate.com/wp-content/uploads/2020/07/US-Retail-MarketBeat-Q4-2019.pdf
[2] Cushman Wakefield, Marketbeat Report, U.S. National Shopping Center Q1 2020.
[3] Cushman & Wakefield, Marketbeat U.S. National Shopping Center Q4 2020.
Lessons from Fairfax County, Virginia
Overestimating trip generation can have deleterious effects on a neighborhood because trip generation is so closely linked to the amount of square footage that a property is allowed. Mike Workosky, transportation planner and President of Wells + Associates, explains, “More than any other feature of a development, vehicle trip generation estimates determine density limits and impacts.”
First, a locality decides whether a particular development is suitable based on surrounding land use interactions, then its traffic impacts are assessed. If traffic estimates are inaccurately high, then developments will ultimately be denied square footage that they could have responsibly maintained. That loss of square footage represents millions of dollars in potential economic development that is forfeited, between commercial leases, property and sales taxes, and job creation.
If the county had known its development plan would work so well, what would they have done differently? In all likelihood, the county could have approved more square footage of commercial real estate.
In a sense, Fairfax County outdid itself. It laid out a complex and long-term plan for responsible urban development which set conservative and achievable goals and did an exemplary job creating the prominent edge city within a thriving county that Tysons is today. Fairfax County’s record is proof that balanced development which values multimodality and deploys TDM is extremely effective at mitigating traffic impacts.
Neither developers nor municipalities want to leave square footage on the proverbial “table”. Going forward, the low “baseline” of trip generation in Fairfax County, the downward trajectory of ITE’s trip estimates, as well as market conditions that are putting downward pressure on traffic all present a unique opportunity. If local jurisdictions like Fairfax were hesitant about pursuing more dense development back in 2007, they should be confident today. Especially considering the growth of ecommerce and what are sure to be long-term impacts of the COVID-19 pandemic, trip generation is likely to continue to drop in coming years.
Armed with both historical performance metrics and clear trends, developers across the U.S. can now make a strong case for why traffic congestion concerns should not be an impediment to the approval of higher density. When municipalities and developers agree to add TDM strategies to conditions of development, they can utilize TDM to insure against negative traffic impacts—not just for the first year or two, but for the long-term future.