Transportation considerations, including near-term health concerns regarding mass transit ridership, are a key factor in ensuring office space can be safely reoccupied. Newmark Knight Frank, in partnership with transportation consulting firm Wells + Associates, surveyed NKF office property management professionals to assess their priorities as they prepare to serve tenants in the period ahead. Property management professionals at NKF have a keen understanding of the needs not only of their tenants but of their owner-investor clients as well; the survey results reflect this collaboration as they work to meet the evolving challenges presented by the COVID-19 pandemic.
Introduction
Commercial real estate and the transportation sector have both been greatly impacted by COVID-19 and the related stay-at-home orders that were implemented around the country. Virtually overnight, many office properties were temporarily closed or mostly vacated, with tenants transitioning to teleworking. The COVID-19 pandemic has many tenants rethinking the nature of work, with competing considerations creating tension: the need to allow for more space for each worker in the office (to better accommodate social distancing) and the possibility of incorporating more remote work into a long-term occupancy strategy. Concerns about maintaining corporate culture and the isolation of the work-from-home environment also play a role in decision making around office space needs and preferences.
Transportation considerations, including near-term health concerns regarding mass transit ridership, are a key factor in ensuring office space can be safely reoccupied. Shared mobility has been dramatically affected, with subway ridership in major cities declining by as much as 95 percent in mid-March, shortly after the pandemic was recognized as a national emergency in the U.S. The rate of infections has varied around the country, and some states experienced an increase in coronavirus cases as summer began. However, as others are ending stay-at-home orders and tenants contemplate a return to the office, property managers must be prepared for shifts in how people travel. To that end, Newmark Knight Frank, in partnership with transportation consulting firm Wells + Associates, surveyed NKF office property management professionals to assess their priorities as they prepare to serve tenants in the period ahead. Property management professionals at NKF have a keen understanding of the needs not only of their tenants but of their owner-investor clients as well; the survey results reflect this collaboration as they work to meet the evolving challenges presented by the COVID-19 pandemic.
Key Findings
- Managers of urban office properties are concerned that over the coming year their assets will be subject to a variety of transportation challenges, such as decreased accessibility from public transit, increased demand for on-site parking, increased demand for on-site bicyclerelated amenities, and increased traffic around their sites in urban areas.
- Managers of office properties in suburban and exurban locations are not as concerned as their urban counterparts about transportation challenges over the coming year.
- Managers of urban properties are concerned about both an increase in telework as well as reduced occupancy and rental rates, suggesting they believe an increase in telework will place downward pressure on asset performance.
- Managers of properties in suburban and exurban locations generally do not expect occupancy or rental rates to decrease over the coming year, but they are more concerned about the possibility of decreased occupancy than decreased rental rates.
- Most property managers are uncertain about how commute patterns may change in the coming year and are currently maintaining their transportation amenities until tenants’ future needs are clearer. However, an emerging trend to watch is an increase in bicycle storage among urban properties, likely a response to concerns about the safety of mass transit.
- Opportunities exist for asset owners to better inform their tenants about transportation options through expanded individualized marketing and communication efforts.

Survey Results
Transportation Concerns
To gauge property managers’ concerns about office tenants returning to work and their transportation needs, the survey
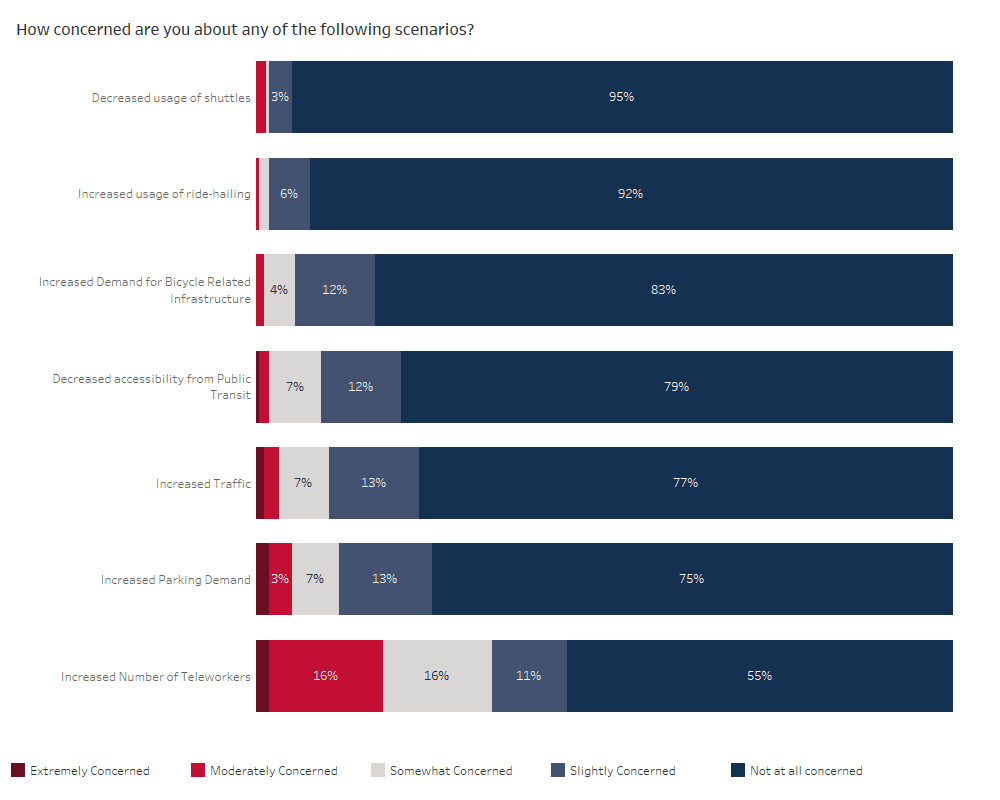
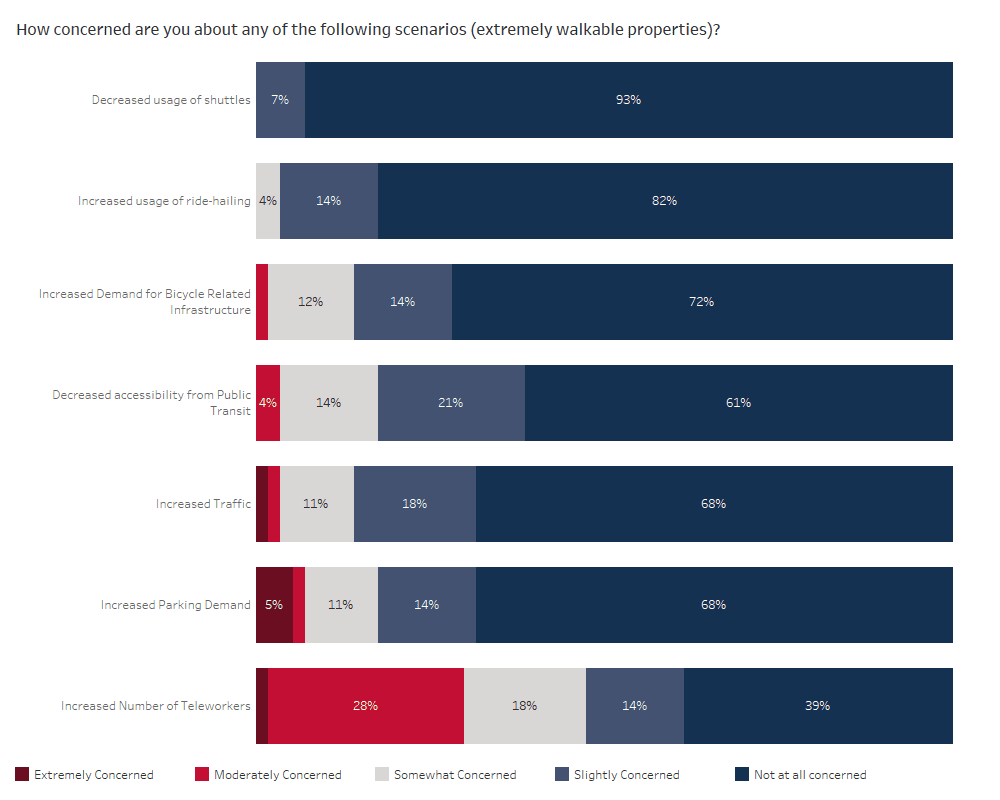
presented seven different potential scenarios that could take place as a consequence of the COVID-19 pandemic and asked them to rate their level of concern. Respondents were asked to categorize each scenario as something about which they are extremely concerned, moderately concerned, somewhat concerned, slightly concerned, or not concerned at all.
Below are the scenarios ranked by level of concern:
- Increased number of teleworkers (45%)
- Increased parking demand (25%)
- Increased traffic (23%)
- Decreased accessibility from public transit due to changing schedules or routes (21%)
- Increased demand for bicycle-related infrastructure (17%)
- Increased usage of ride-hailing (8%)
- Decreased usage of shuttles (5%)
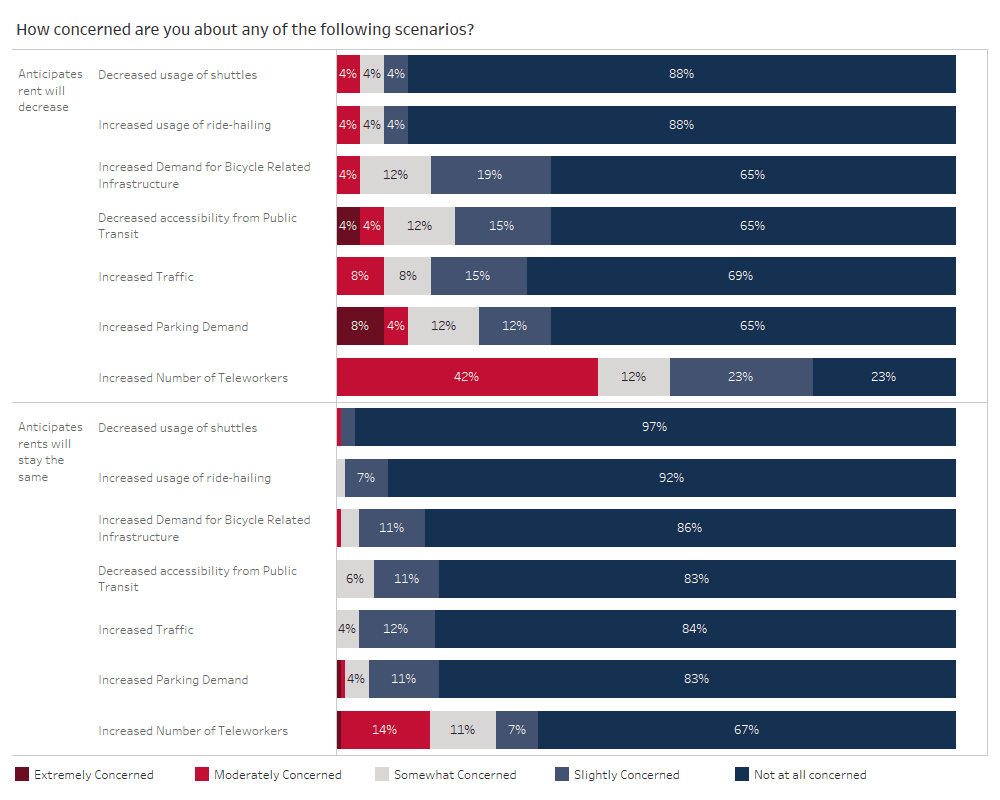
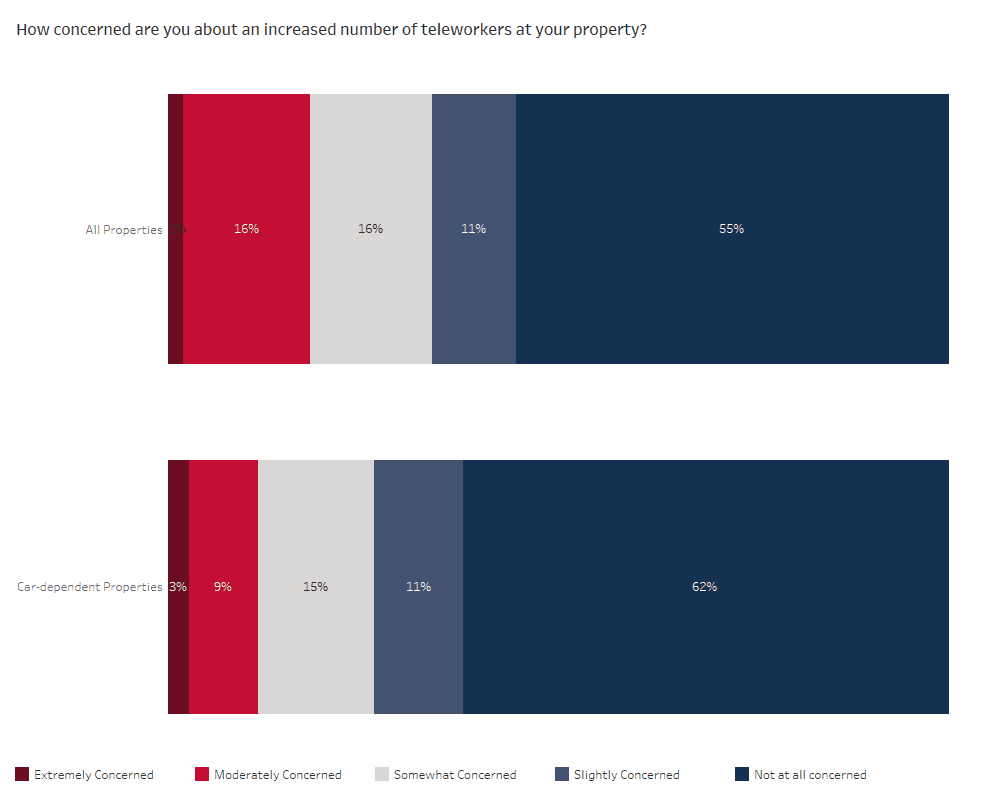
Overall, the managers of properties surveyed responded that they are not acutely concerned about the seven scenarios; each scenario was rated “not at all concerned” by at least 55% of properties surveyed (see Figure 3 in the appendix). However, among all properties, the area of most concern was about a potential long-term increase in the number of teleworkers. Breaking down the level of concern by WalkScore category reveals that the levels of concern about each scenario vary greatly among properties depending on location. Please see the Methodology section in the appendix for a full explanation of how WalkScore categories were calculated.
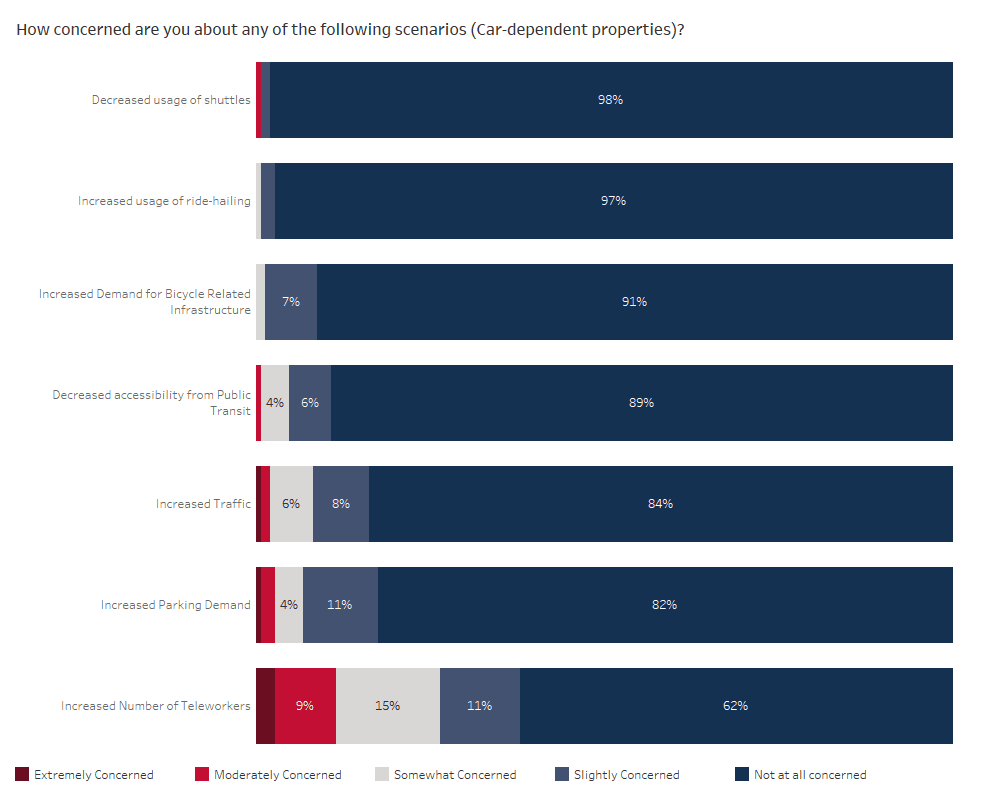
Managers of properties in Car-Dependent locations are the least concerned about the provided scenarios: 62% of such properties are not at all concerned about increasing numbers of teleworkers, compared to 55% of all properties (see the exhibit below as well as Figure 4 in the appendix). It is logical that managers of CarDependent locations, generally suburban properties, would be less concerned about teleworking, since suburban office assets have seen an uptick in interest due to commuter wariness of mass transit until a coronavirus vaccine is created—their lack of concern may not be tied to the properties’ ability to accommodate change but rather because they anticipate their space will be in greater demand. More than a third (38%) of respondents were concerned about increased teleworking, making it the scenario with the highest level of concern for properties in Car-Dependent locations. The other scenarios, including increased parking demand, all rank much lower in level of concern, probably because these Car-Dependent locations are already designed with a high number of drivers in mind.
Properties in the most walkable category, Extremely Walkable, were more likely to be concerned about the proposed scenarios (see Figure 5). More than half (61%) of properties in Extremely Walkable locations were at least slightly concerned about an increase in the number of teleworkers, compared to 45% among all properties. More than a third (39%) were also concerned about decreased accessibility from public transit, compared to 21% of properties overall. Additionally, properties in the most walkable places are more concerned about an increase in parking demand compared to those in Car-Dependent locations: 32% of properties in Extremely Walkable locations were concerned about an uptick in parking demand compared to only 18% in Car-Dependent locations. Walkable properties are likely accustomed to a larger percentage of tenants arriving by non-driving modes and may not be prepared for an increased share of tenants commuting by single-occupancy vehicles, a possibility as commuters seek to better protect themselves from possible COVID-19 transmission.
Transportation Amenities and Information
Transportation demand management (TDM) is an approach that many commercial properties deploy to handle traffic and parking challenges, some of which survey respondents believe could occur due to the COVID-19 pandemic. TDM reduces travel demand at specific sites by developing strategies for commuter behavior change, as well as educating and encouraging commuters to explore and utilize all of their transportation options in a safe and/or socially distant way. Reducing car trips by promoting carpool, biking, walking, and using public transportation can relieve pressure on a property’s parking infrastructure and improve the quality of life for tenants by reducing traffic-related stress. In many cases, TDM strategies are positioned by properties as transportation amenities designed to promote multimodality to the site.
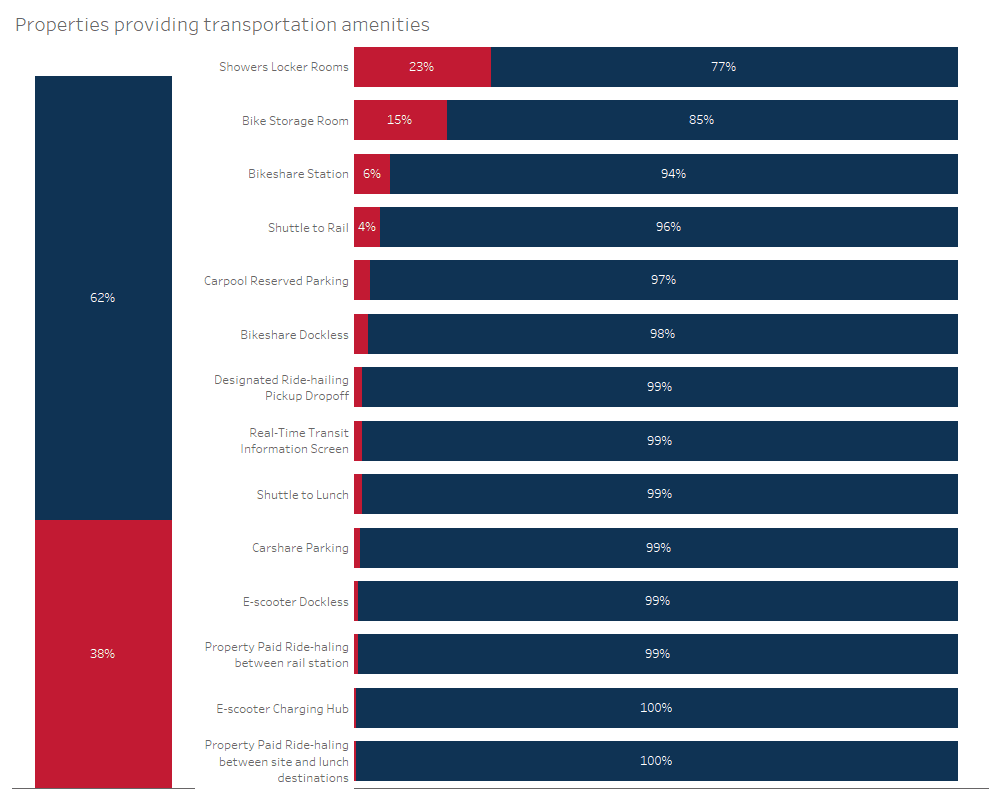
More than a third (38%) of all properties surveyed offer some sort of transportation amenity that supports commuting by a method other than driving alone (see Figure 6). The three most common amenities support biking to work: showers/locker rooms, bike storage rooms and bikeshare stations. While less common, properties also reported providing shuttles to rail stations, reserved parking for carpool vehicles, as well as nine other amenities.
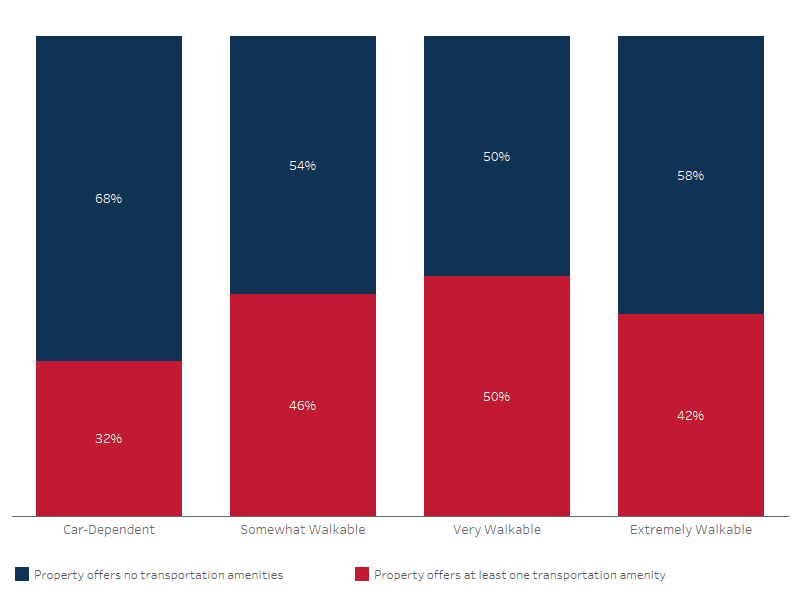
The availability of transportation amenities varies depending on the WalkScore category of buildings’ locations (see Figure 7). Nearly a third (32%) of properties in Car-Dependent locations offer amenities, whereas 43% of properties in Somewhat Walkable locations, 50% of properties in Very Walkable locations, and 42% of properties in Extremely Walkable locations offer transportation amenities. Properties in Car-Dependent locations may be less likely to offer amenities to encourage non-driving commutes because their individual efforts may not be impactful in a community that lacks multimodal transportation infrastructure. More walkable locations usually offer this type of infrastructure, which can support and augment individual buildings’ transportation amenities.
Last-Mile Connections
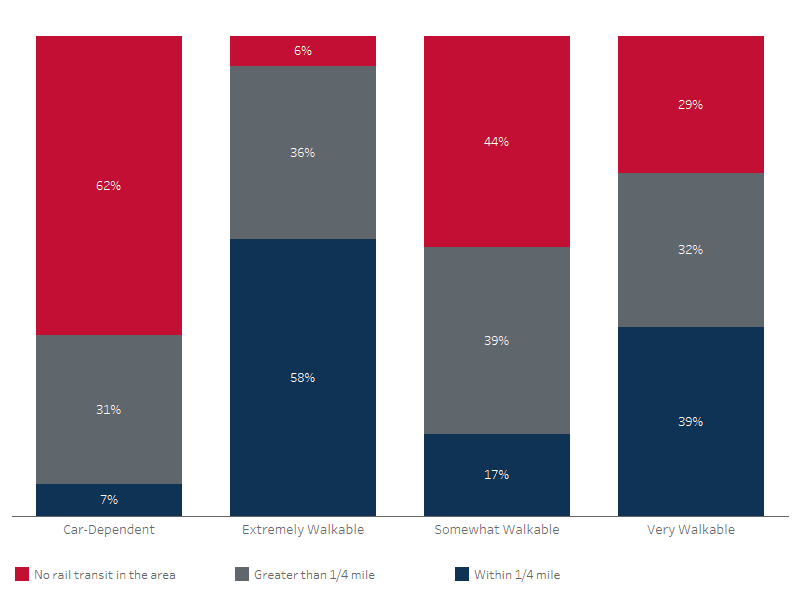
Interestingly, 8% more properties in Very Walkable locations offer amenities than properties in Extremely Walkable locations. This may be because these properties are positioned slightly farther from transit connections and suffer from what is known as “lastmile” connection problems. Many office buildings struggle with last-mile connections when they are situated too far from public transportation for their tenants to comfortably walk to the site from transit stops. Numerous NKF properties employ transportation services, like shuttles to rail service, to help bridge this last-mile gap. For instance, a majority of surveyed properties with shuttle programs are greater than one mile from a rail station.
Bike Amenities
Bike storage rooms are most popular in locations within a quarter-mile of a rail station, perhaps because this amenity is most useful in locations that are more urban in design, have more bike-friendly infrastructure, and a higher rate of biking. However, bikeshare stations are split between areas closest to a rail station and areas with no rail service; the popularity of bikeshare stations near properties with no rail service may be due to the increase in smaller cities which lack rail service implementing bikeshare systems. For example, NKF properties in Riverside, California, and Ann Arbor, Michigan, reported having bikeshare stations on the premises.
Transportation Communication
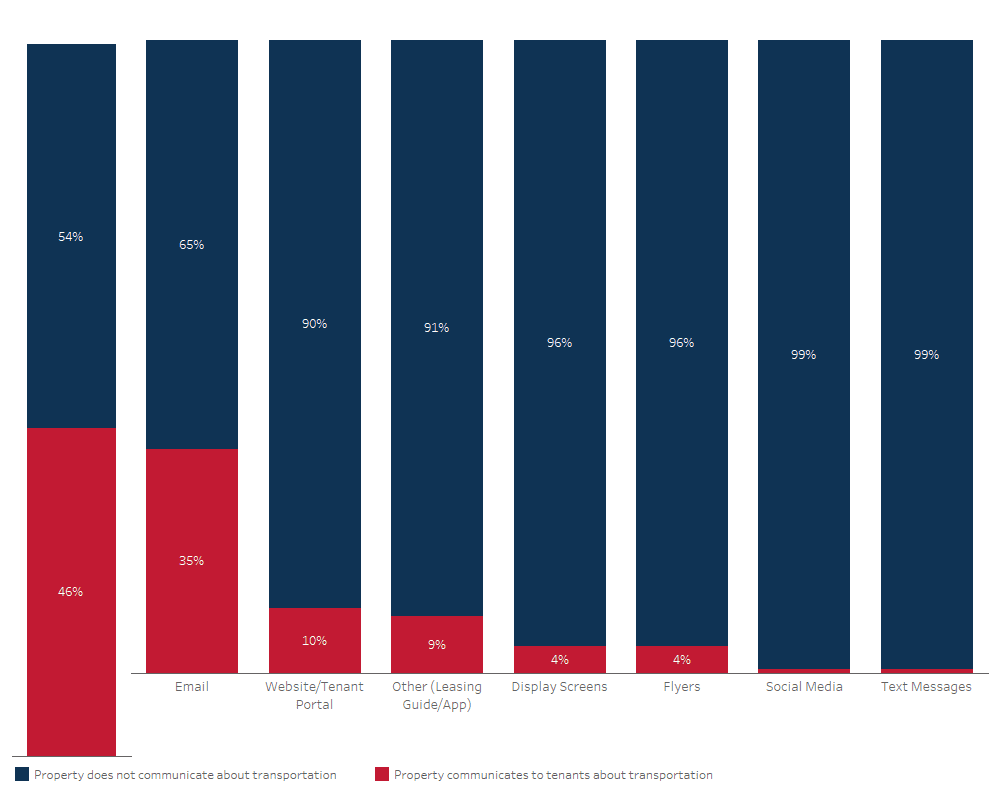
Nearly half (46%) of properties surveyed reported communicating with tenants about their transportation options (see Figure 9), notably higher than the number of properties offering amenities (38%) (although this is not surprising since properties can promote transportation options in their area without providing services on-site). Among all properties surveyed, the most common method of communication was Email, with 35% of properties reporting that they send out transportation updates to their tenants. Website and Tenant Portals are used to share this information by 10% of properties surveyed. Only 35% of Car-Dependent locations actively communicate to their tenants about transportation whereas 57% of properties in the other, more walkable, WalkScore categories communicate about transportation. These more walkable locations may have more to communicate about, given that they tend to provide more transportation amenities and are situated in locations with more transportation options than their Car-Dependent counterparts.
Anticipated Changes to Transportation Amenities
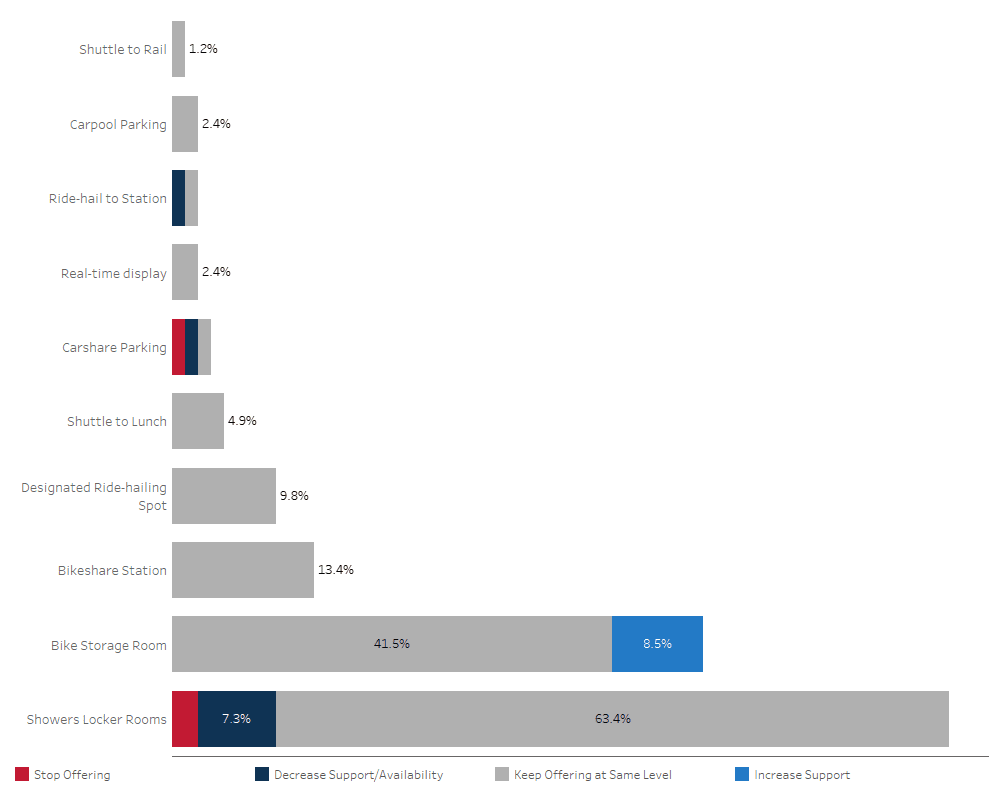
The survey also asked about intentions to change the level of service for any existing transportation amenities due to the COVID-19 pandemic, or whether properties planned on adding any amenities that they do not currently offer. Overwhelmingly, properties that offer amenities plan to keep offering those amenities for the foreseeable future and at current levels of service—without decreasing or increasing availability.
Only seven properties said they were planning on adding new transportation amenities. These properties were all located in Extremely Walkable locations except for one, which was located in a Somewhat Walkable location, and all seven said they planned on increasing support for bike storage rooms.
Eleven properties reported that they planned on reducing or eliminating transportation amenities. One property in a Car-Dependent location is going to reduce ride-hailing support to train stations. Carshare is losing support from two properties; one property in a Car-Dependent area is planning to stop offering carshare parking altogether and one property in a Somewhat Walkable area plans to reduce support for carshare parking. Finally, eight properties plan on reducing their support for on-site showers and/or locker rooms; four properties in Car-Dependent areas plan to reduce support for showers and/or locker rooms, two properties in more walkable areas (Somewhat and Very Walkable) are reducing support for showers and/or locker rooms, and two properties plan to stop offering showers and/or locker rooms altogether. Interestingly, one property eliminating this amenity is in a Car-Dependent location while the other is in an Extremely Walkable location.
On the whole, properties did not report that they were planning on adding new transportation amenities. Due to the economic conditions and uncertainties associated with the COVID-19 pandemic, property managers may be hesitant to budget for capital improvements, and some may need to reduce costs. This finding may reflect that property managers are uncertain about when they will reopen or what commute mode changes may take place in the coming months—they do not want to overreact and spend capital unnecessarily, nor do they want to underreact and potentially lose tenancy due to insufficient amenities. The most common change reported is a reduction in transportation amenities: carshare parking, ride-hailing, and showers/locker rooms are being reduced or closed in properties of all different WalkScore categories. However, one amenity stands out as garnering additional interest; bike storage is the only amenity receiving increased support in some Very and Extremely Walkable locations, perhaps reflecting the increase in biking during the pandemic which has been reported anecdotally. Biking enables people to socially distance and may be perceived as a safe form of transportation during the pandemic.
Anticipated Changes to Occupancy and Rental Rates
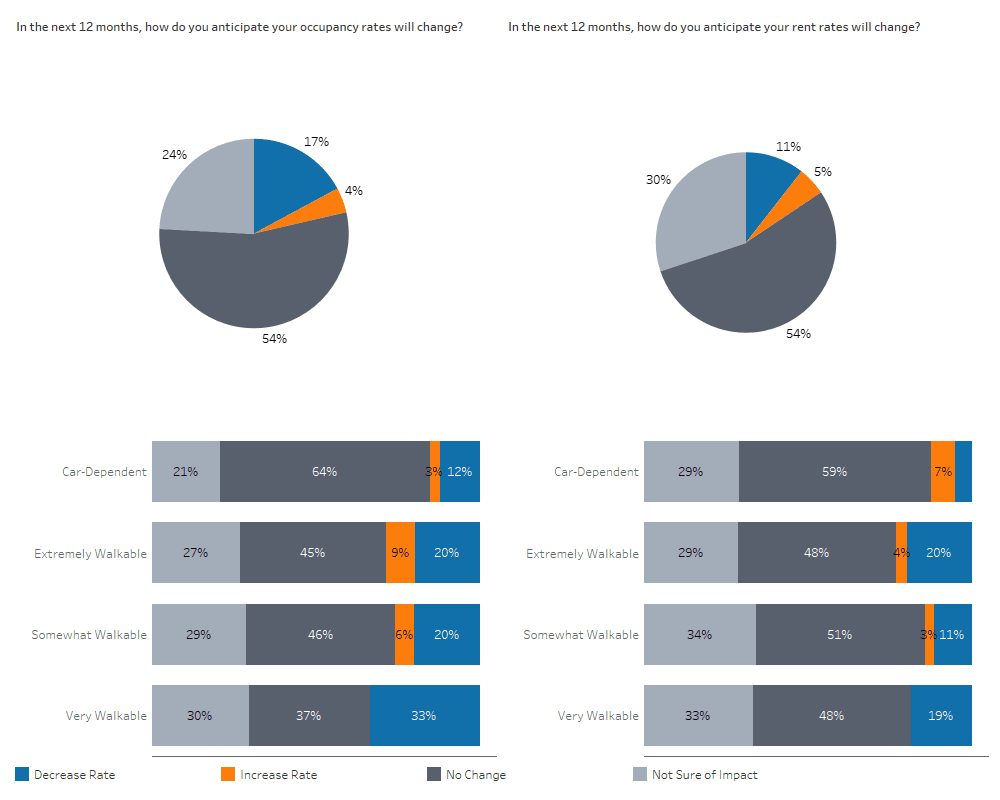
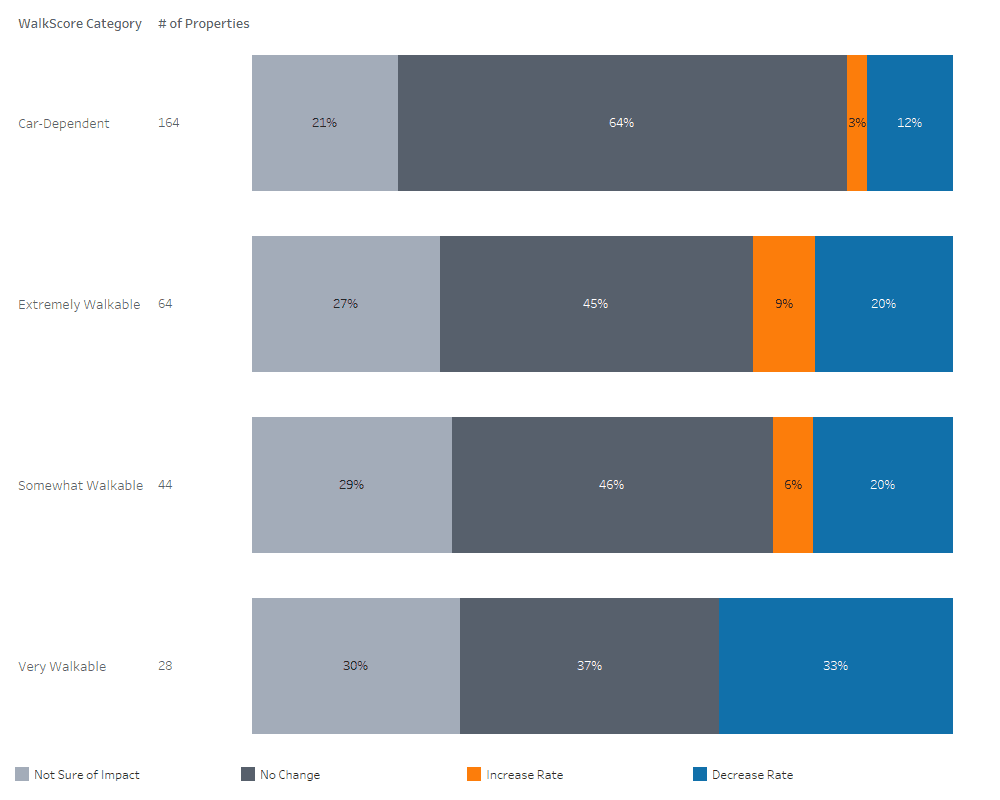
Finally, the survey asked property management professionals about their properties’ occupancy and rent rates, and what changes, if any, they anticipate over the next 12 months. More than half (54%) of properties surveyed reported that they anticipate their occupancy rates will not change in the next 12 months (see Figure 11), although 17% are concerned that their occupancy rates will decrease. Nearly a quarter of properties surveyed (24%) are not sure how their occupancy rates will change. More than half (54%) of properties surveyed also reported they anticipate their rent rates will not change in the next 12 months (see Figure 11), although 11% anticipate their rent rates will decrease. Almost a third (30%) of properties are not sure how their rent rates will change. The relative lack of anticipated change in both occupancy and rental rates could be because many tenants are signed to multi-year leases, which will not be impacted within the next year. Another factor may be the lack of clarity about how office tenants will react to the pandemic, with some seeking to maintain or even add space to accommodate social distancing for those in the office, while others consider reducing their space requirements or placing space on the sublease market as more employees telework.
Properties in Car-Dependent locations are the least likely to anticipate occupancy or rent rate decreases: only 12% of properties in Car-Dependent locations anticipate a decrease in occupancy rates and only 5% anticipate a decrease in their rent rates. This is consistent with the market’s current emphasis on suburban locations, or hub-and-spoke office models, as more functional during a pandemic (see the adjacent exhibit as well as Figure 11 in the appendix). Properties in more walkable locations anticipate decreases in occupancy and rent at higher rates, with a fifth of properties in Somewhat Walkable and Extremely Walkable locations anticipating a decrease in occupancy rates. For Very Walkable locations, this increases to a full third of properties. While properties in walkable locations expect decreases in rent to a lower degree than they expect decreases in occupancy, there is still a significant concern about rent: 11% of properties in Somewhat Walkable locations, 19% of properties in Very Walkable locations, and 20% of properties in Extremely Walkable locations anticipate a decrease in rent over the next 12 months.
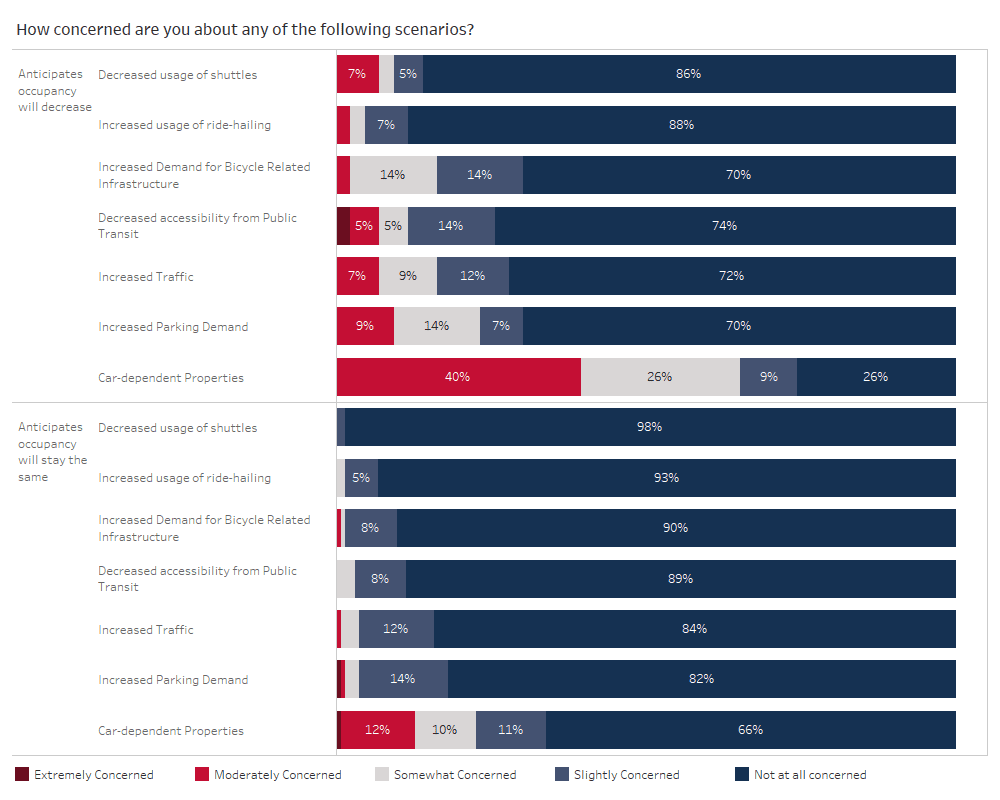
Managers who anticipate a decrease in occupancy or rent rates at their properties are also more likely to be very concerned about an increase in telework (see Figure 12) and transportation issues, such as increased parking demand, increased demand for bicycle-related infrastructure, and increased traffic. For example, nearly three quarters (74%) of property managers who said they anticipate occupancy will decrease are at least somewhat concerned about an increase in telework, while only a third (34%) of managers at properties that anticipate no change in occupancy are concerned about an increase in telework. Similarly, nearly a third (30%) of managers at properties that anticipate a decrease in occupancy are at least somewhat concerned about increased parking demand, while only 18% of managers at properties that anticipate no change in occupancy are concerned about increased parking demand.
Conclusions and Recommendations
Based on survey results, properties in urban markets appear more likely to experience transportationrelated impacts from the COVID-19 pandemic than similar properties in less urban contexts. Strategies currently being deployed in both urban and suburban contexts are informative for how properties can prepare for changing conditions related to the ongoing COVID-19 pandemic. Possible strategies include the following:
For all properties, asset owners and their property managers may wish to:
- Develop a communications plan to educate tenants about their transportation options during COVID-19 (regardless of whether the property provides transportation amenities) to encourage safe use of multimodal transportation during and after the pandemic.
- Consider increasing bike storage to improve connectivity and support multimodal transportation.
For urban properties, asset owners and their property managers may wish to:
- Consider expanding transportation amenities such as on-site bicycle storage and bikeshare/ scooter-share stations to enhance connectivity and remain competitive with more suburban properties, which are less likely to face parking shortages and other transportation concerns.
- Develop a communications plan about how to safely commute to work with social distancing via transit, shuttles and carpools. They may also wish to review with tenants the COVID-19 safety precautions being taken by the building, such as the cleaning protocols of transportation amenities or local bike/scooter share stations.
- Increase transportation amenities that solve last-mile challenges, such as shuttle or ridehailing services to nearby public transit stops, particularly for those assets with a WalkScore between 50 and 89 or located between a half-mile and 1.5 miles from a transit station.
- Incentivize tenants to carpool by creating reserved carpool spaces closer to building entrances and/or providing these spaces at free or reduced rates.
- Re-examine meeting and collaboration spaces; larger and more flexible meeting spaces can confer a competitive advantage in the current environment.
Methodology
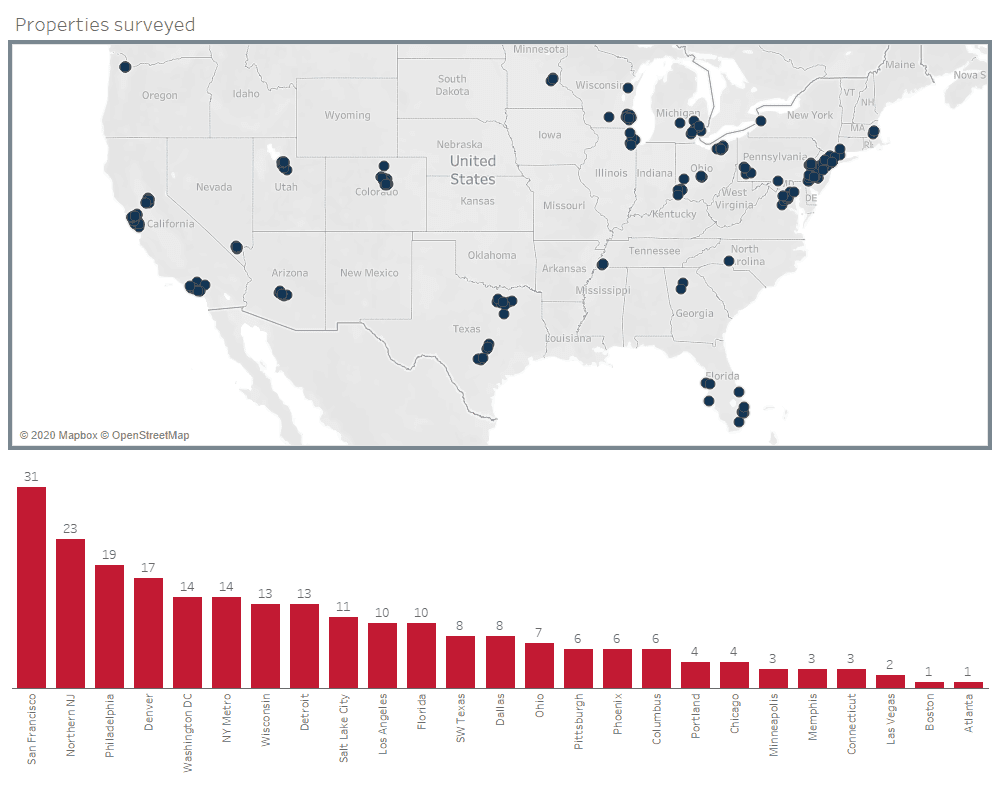
To gauge the concerns of property managers related to COVID-19 and transportation, Newmark Knight Frank partnered with Wells + Associates to distribute a survey to managers of NKF’s office portfolio. These management professionals are attuned to both the needs of their tenants and their investor-owner clients, giving their opinions a unique and insightful position in the commercial real estate industry. The survey was completed in May and June 2020 by managers representing 300 properties across the country, approximately 67% of the NKF office portfolio. The survey asked property managers at NKF properties about:
- The types of transportation amenities the building provides to tenants and if they plan to make any changes over the next 12 months;
- Whether they actively communicate with tenants about transportation;
- What transportation-related concerns they may have at their property; and
- How they see the pandemic impacting their rents and occupancy rates over the next 12 months.
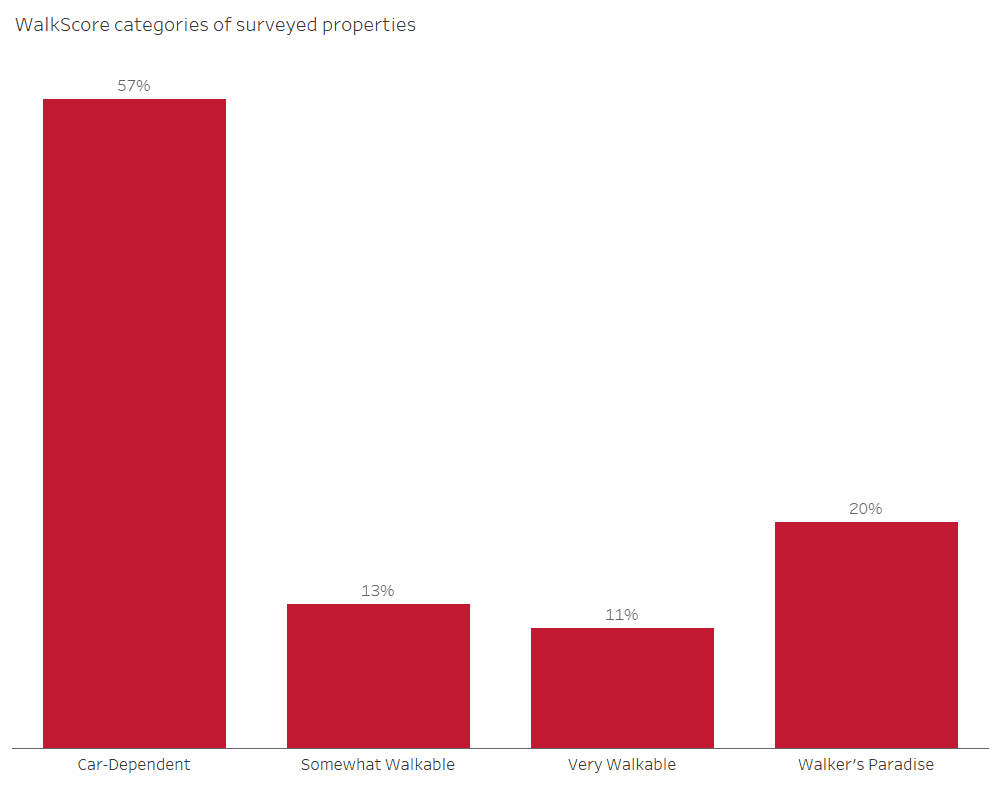
NKF manages properties in markets around the country, including urban, suburban, and exurban locations. WalkScores were considered as part of the analysis. (WalkScore assigns a score from 0–100 to measure the degree of walkability in an area. The methodology analyzes walkability of an area; the higher the WalkScore for an address, the more amenities an individual can walk to in a shorter amount of time.) Using ratings from WalkScore, the properties surveyed were broken into categories based on degree of walkability to approximate each site’s level of urbanity. Using the individual scores, surveyed properties were organized into four categories: Extremely Walkable (90–100), Very Walkable (70–89), Somewhat Walkable (50–69), and CarDependent (0–49). Extremely Walkable locations do not require a car for daily errands, Very Walkable locations do not typically require a car, Somewhat Walkable locations require a car for some errands, and Car-Dependent locations require a car for most or all errands. Survey results were analyzed using these WalkScore categories to gain deeper insight into the ways in which buildings in different types of locations are being differentially impacted by COVID-19 and its associated transportation challenges.
Sources
- Association for Commuter Transportation
- Centers for Disease Control and Prevention
- The Guardian
- NKF Research
- Walkscore
- Washington Metropolitan Area Transit Authority
- Wells + Associates
Leadership of Survey Project
Newmark Knight Frank
Dan Orcutt Director, Management Services
Alexander (Sandy) Paul, Senior Managing Director of National Research
Chris Prather National, Director of Operations
Sam Willger, Senior Graphic Designer
Wells + Associates
Camille Galdes, Research Associate
Justin Schor, Principal, Planning + Market Research
Matthew Holden, Data Scientist
Courtney Menjivar, Principal
Appendix
Key exhibits are cited in the preceding narrative; others are included here for additional context on the sample of properties surveyed and property managers’ reactions to the current office market environment.