
How can property developers, owners, and managers improve their understanding of tenant behavior, provide better services, and improve tenant satisfaction? Transportation data dashboards that measure the use of amenities and tenant travel behavior are a great way to make this happen.
To illustrate this, we created a sample data dashboard inspired by the fictional world of Harry Potter. In this case, the fictional wizard village of Hogsmeade has been turned into the “Hogsmeade Business Center.” Let’s have some fun while investigating the benefits of data dashboards!
Measuring and Analyzing a Property’s Transportation Amenities
Hogsmeade Business Center is going through a significant transformation. Taking a cue from Muggledom, Hogsmeade’s owners knew the time was right to increase the occupancy and retention of wizards who live and work in their property.
Times were changing, from the rise of hybrid work models in the wizarding world to transit-related transportation patterns and the desire for improved active transportation networks. I mean, what wizard isn’t enamored of muggle transit machines?
But how in the world do you make the right decisions, both for investment purposes and in real time, to satisfy tenant needs, while tenants are in the middle of using (or not using) your property’s facilities and transportation amenities?
“Do you splurge on new broomstick facilities or go in the trendy direction … such as Muggle-inspired bikerooms and bike facilities?”
For example, do you splurge on new broomstick facilities or go in the trendy direction … such as Muggle-inspired bikerooms and bike facilities? (We all know floo networks are a thing of the past.)
Data Dashboards Help CRE Properties Measure KPIs and Make Decisions
Data dashboards help property developers, owners, and managers determine the key performance indicators (KPIs) that will significantly impact their investments and improve their tenants’ satisfaction. As our Mobility Management and TDM team likes to say, meeting your goals is more challenging if you can’t measure them.
Here is a small taste of how Hogsmeade is using transportation data dashboards …
Track Program Effectiveness and ROI
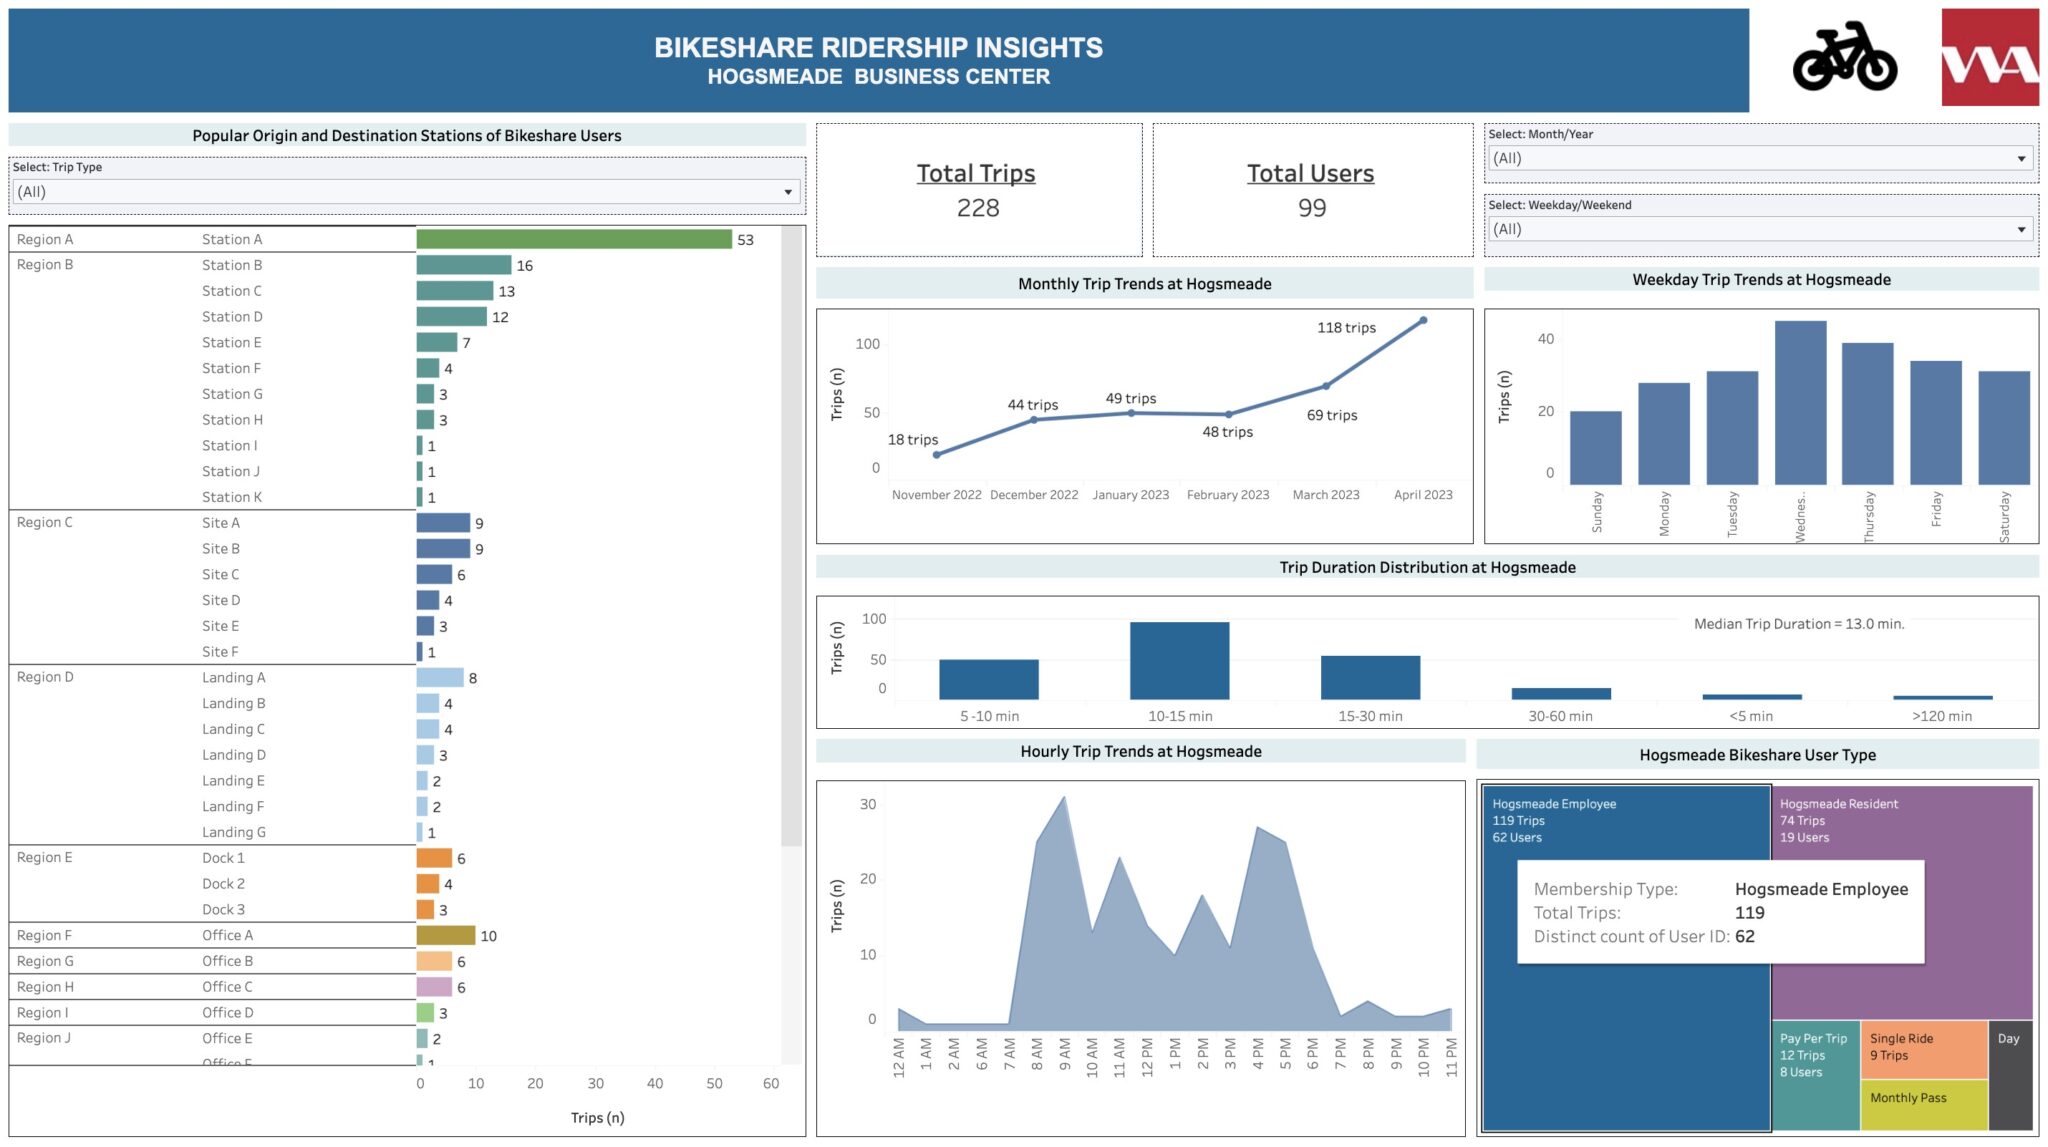
 Hogsmeade Business Center recently installed a new bikeshare program. But how is it performing?
The dashboard here helps Hogsmeade Business Center track its ROI from the new bikeshare program. KPIs that measure the effectiveness of a transportation amenity/service like this bikeshare amenity vary based on a program’s goals. Dashboards galvanize these KPIs – they tell a story that helps managers make decisions.
Empower Your Decisions with Data That Tell Stories
Dashboards don’t merely provide data. Set up properly, dashboards can deliver essential information rather than raw data – they empower property managers to make assessments and make decisions based on actual information, not sentiment (such as, “this amenity is all the craze, so we should do that, too”).
While KPIs can prove the program’s effectiveness, external factors (for example, socioeconomic backgrounds, trip purposes, and demographics) drive those KPIs. Researching such KPI drivers with transportation consultants and incorporating user-friendly ways to query such background information will help property managers become storytellers – stories describing how their tenants respond to program initiatives.
Dynamic Decision-Making at Your Fingertips
Dashboards enable dynamic decision-making toward program parameters and financial investments. Measured over time, access to life-cycle ROI metrics of any transportation amenity helps CRE developers and property managers estimate future financial needs and create budgets for similar projects in various geographic settings.
Dashboards and the data presented inside them can and should be customized. For example, incorporating a geospatial element into such dashboards will also help properties benchmark themselves against the market.
Because if wizards are going to implement transportation systems that help modernize commercial real estate properties, they won’t be able to depend on magic, much less wishful thinking. Data, and the dashboards built to present that data, can make the difference.